2024《US News美国新闻与世界报道》修改了全国大学排名计算法
在《美国新闻》的 2024 年大学排名中,许多常享盛誉的院校仍然位居榜首,但一些学校的排名也大幅提高。
《美国新闻》执行长埃里克·格特勒在一份声明中表示:「今年排名方法的重大变化是持续演化的一部分,以确保我们的排名能够反映学生在比较大学最重要的因素时,能选择最适合自己的学校。」
变革为适应学生学术需求和财务状况
在这个重大的改变之前,很多人抱怨旧排名强化精英主义(Elitism) ,无助于帮学生找到适合他们的学术需求和财务状况的学校。
新排名更加强调“社会流动性”- 通常是指个人在教育、收入和其他社会经济地位标志方面所取得的进步。
今年彻底修改使用19 项学术品质指标来评估学校,放弃了影响排名的五个因素:1.班级规模2.拥有最终学位的教师3.校友捐赠4.高中班级排名5.借用联邦贷款的毕业生比例。
请参阅注释 1 – Methodology方法论。
新排名 – 更重视大学毕业生的社会流动性与事业成果
今年新的《美国新闻》更重视多少学生来自各社会经济背景获得学位,并利用了最近才获得的毕业生资讯。
这个新计算方法导致学校排名发生重大变化。
结果,越来越多的学校包括哥伦比亚大学、哈佛大学和耶鲁大学法学院等精英学院停止参与排名,并公开批评《美国新闻与世界报道》的新排名方法。
排名: 公立上升,私立大学下滑
总体而言,有十几所公立(州立)大学在年度排行榜上上升了 50 位。尽管如此,传统名校 仍然坚守阵地。
许多学生和家庭参考该排名来选校。公立大学在《美国新闻》的排名中取得了很大的进步,例如,德州大学圣安东尼奥分校和加州州立大学东湾分校分别跃升 92 位和 88 位。其他知名公立大学,如新泽西州罗格斯大学,其三个校区各上升了至少 15 名。
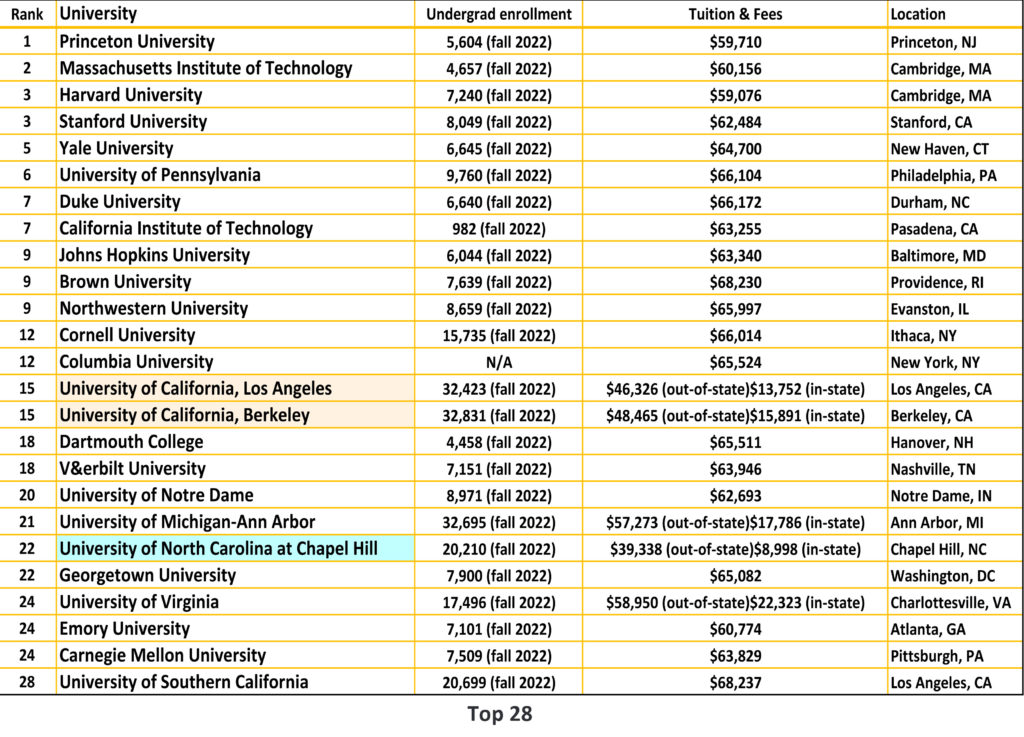
尽管采用了新的排名制度,《美国新闻》排行榜上的前十名大学几乎没有变化。普林斯顿大学在新学年排名第一,其次是麻省理工学院、哈佛大学、史丹佛大学和耶鲁大学。
在以文理科(Liberal Arts)为主的学校中,马萨诸塞州的威廉斯学院排名第一,阿默斯特学院、美国海军学院、加州的波莫纳学院和宾夕法尼亚州的斯沃斯莫尔学院跻身前五名。
2024 Best National Universities – Top 3
- Princeton University (NJ)
- Massachusetts Institute of Technology
- Harvard University (MA) (tie)
- Stanford University (CA) (tie)
2024 Best National Liberal Arts Colleges – Top 3
- Williams College (MA)
- Amherst College (MA)
- United States Naval Academy (MD)
2024 Top Public Schools: National Universities – Top 3
- University of California, Berkeley (tie)
- University of California, Los Angeles (tie)
- University of Michigan, Ann Arbor
2024 Top Public Schools: National Liberal Arts Colleges – Top 3
- United States Naval Academy (MD)
- United States Air Force Academy (CO)
- United States Military Academy at West Point (NY)
2024 Top Performers on Social Mobility: National Universities – Top 3
- California State University, Long Beach
- California State University, Fullerton (tie)
- California State University, Riverside (tie)
- California State University, San Bernardino (tie)
- University of California, Merced (tie)
2024 Top Performers on Social Mobility: National Liberal Arts Colleges – Top 3
- Lake Forest College (IL)
- Agnes Scott College (GA) (tie)
- Salem College (NC) (tie)
- Spelman College (GA)
Schools with significant increases in their rank:
Southeastern Baptist Theological Seminary (NC) +106
University of Texas at San Antonio (TX) +92
California State University, East Bay +88
Florida Gulf Coast University +80
University of Texas Rio Grande Valley +72
Gwynedd Mercy University (PA) +71
University of Nevada, Reno +68
Northern Arizona University +68
The University of Texas at El Paso +68
California State University, Fresno +65
The University of Texas at Arlington +63
Northern Illinois University +62
Aurora University (IL) +62
Texas Woman’s University +62
San Francisco State University (CA) +56
Florida Atlantic University +54
Augusta University (GA) +52
University of Wisconsin–Oshkosh (WI) +52
Texas State University +51
University of Houston, Clear Lake +51
Note 1 – The Methodology
How U.S. News Calculated the 2024 Best Colleges Rankings.
https://www.usnews.com/education/best-colleges/articles/how-us-news-calculated-the-rankings
Source:
2024 Best National University Rankings
https://www.usnews.com/best-colleges/rankings/national-universities
“U.S. News’s change in methodology has led to dramatic movement in the rankings overall.
https://www.cbsnews.com/news/us-news-best-colleges-2024-ranking/
“U.S. News’s change in methodology has led to dramatic movement in the rankings overall, disadvantaging many private research universities while privileging large public institutions,” Chancellor Daniel Diermeier and Provost C. Cybele Raver wrote in an email to alumni, according to the news service.
https://www.prnewswire.com/news-releases/us-news-releases-2024-best-colleges-rankings-301928489.html
| Rank | University | Undergrad enrollment | Tuition & Fees | Location |
| 1 | Princeton University | 5,604 (fall 2022) | $59,710 | Princeton, NJ |
| 2 | Massachusetts Institute of Technology | 4,657 (fall 2022) | $60,156 | Cambridge, MA |
| 3 | Harvard University | 7,240 (fall 2022) | $59,076 | Cambridge, MA |
| 3 | Stanford University | 8,049 (fall 2022) | $62,484 | Stanford, CA |
| 5 | Yale University | 6,645 (fall 2022) | $64,700 | New Haven, CT |
| 6 | University of Pennsylvania | 9,760 (fall 2022) | $66,104 | Philadelphia, PA |
| 7 | Duke University | 6,640 (fall 2022) | $66,172 | Durham, NC |
| 7 | California Institute of Technology | 982 (fall 2022) | $63,255 | Pasadena, CA |
| 9 | Johns Hopkins University | 6,044 (fall 2022) | $63,340 | Baltimore, MD |
| 9 | Brown University | 7,639 (fall 2022) | $68,230 | Providence, RI |
| 9 | Northwestern University | 8,659 (fall 2022) | $65,997 | Evanston, IL |
| 12 | Cornell University | 15,735 (fall 2022) | $66,014 | Ithaca, NY |
| 12 | Columbia University | N/A | $65,524 | New York, NY |
| 15 | University of California, Los Angeles | 32,423 (fall 2022) | $46,326 (out-of-state)$13,752 (in-state) | Los Angeles, CA |
| 15 | University of California, Berkeley | 32,831 (fall 2022) | $48,465 (out-of-state)$15,891 (in-state) | Berkeley, CA |
| 18 | Dartmouth College | 4,458 (fall 2022) | $65,511 | Hanover, NH |
| 18 | V&erbilt University | 7,151 (fall 2022) | $63,946 | Nashville, TN |
| 20 | University of Notre Dame | 8,971 (fall 2022) | $62,693 | Notre Dame, IN |
| 21 | University of Michigan-Ann Arbor | 32,695 (fall 2022) | $57,273 (out-of-state)$17,786 (in-state) | Ann Arbor, MI |
| 22 | University of North Carolina at Chapel Hill | 20,210 (fall 2022) | $39,338 (out-of-state)$8,998 (in-state) | Chapel Hill, NC |
| 22 | Georgetown University | 7,900 (fall 2022) | $65,082 | Washington, DC |
| 24 | University of Virginia | 17,496 (fall 2022) | $58,950 (out-of-state)$22,323 (in-state) | Charlottesville, VA |
| 24 | Emory University | 7,101 (fall 2022) | $60,774 | Atlanta, GA |
| 24 | Carnegie Mellon University | 7,509 (fall 2022) | $63,829 | Pittsburgh, PA |
| 28 | University of Southern California | 20,699 (fall 2022) | $68,237 | Los Angeles, CA |
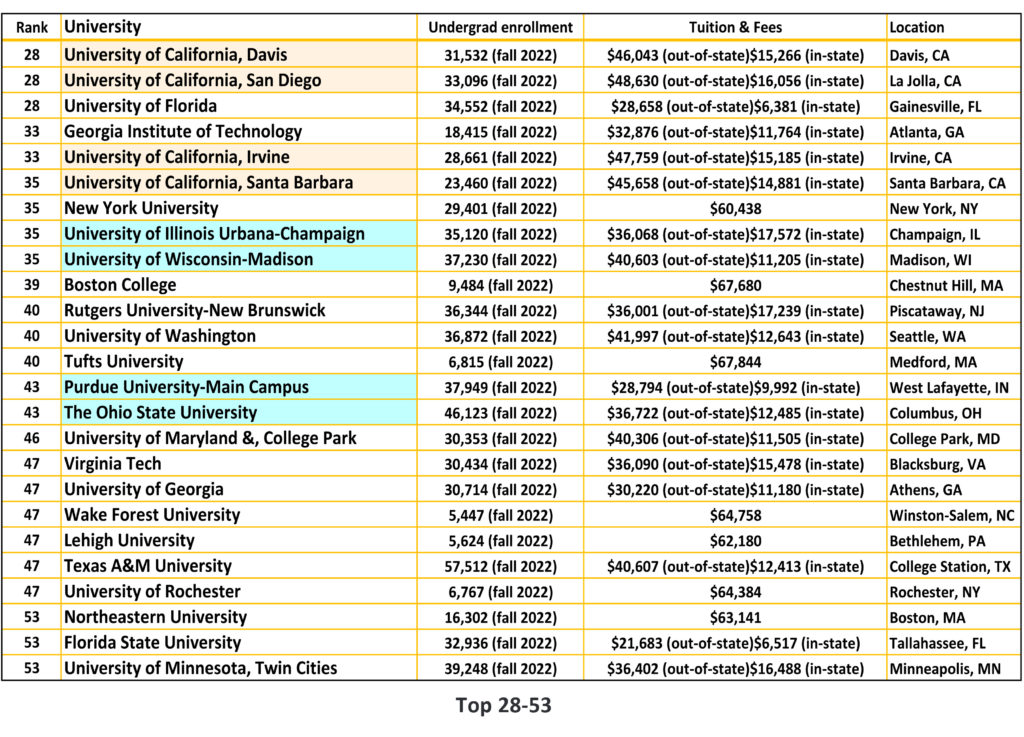
| 28 | University of California, Davis | 31,532 (fall 2022) | $46,043 (out-of-state)$15,266 (in-state) | Davis, CA |
| 28 | University of California, San Diego | 33,096 (fall 2022) | $48,630 (out-of-state)$16,056 (in-state) | La Jolla, CA |
| 28 | University of Florida | 34,552 (fall 2022) | $28,658 (out-of-state)$6,381 (in-state) | Gainesville, FL |
| 33 | Georgia Institute of Technology | 18,415 (fall 2022) | $32,876 (out-of-state)$11,764 (in-state) | Atlanta, GA |
| 33 | University of California, Irvine | 28,661 (fall 2022) | $47,759 (out-of-state)$15,185 (in-state) | Irvine, CA |
| 35 | University of California, Santa Barbara | 23,460 (fall 2022) | $45,658 (out-of-state)$14,881 (in-state) | Santa Barbara, CA |
| 35 | New York University | 29,401 (fall 2022) | $60,438 | New York, NY |
| 35 | University of Illinois Urbana-Champaign | 35,120 (fall 2022) | $36,068 (out-of-state)$17,572 (in-state) | Champaign, IL |
| 35 | University of Wisconsin-Madison | 37,230 (fall 2022) | $40,603 (out-of-state)$11,205 (in-state) | Madison, WI |
| 39 | Boston College | 9,484 (fall 2022) | $67,680 | Chestnut Hill, MA |
| 40 | Rutgers University-New Brunswick | 36,344 (fall 2022) | $36,001 (out-of-state)$17,239 (in-state) | Piscataway, NJ |
| 40 | University of Washington | 36,872 (fall 2022) | $41,997 (out-of-state)$12,643 (in-state) | Seattle, WA |
| 40 | Tufts University | 6,815 (fall 2022) | $67,844 | Medford, MA |
| 43 | Purdue University-Main Campus | 37,949 (fall 2022) | $28,794 (out-of-state)$9,992 (in-state) | West Lafayette, IN |
| 43 | The Ohio State University | 46,123 (fall 2022) | $36,722 (out-of-state)$12,485 (in-state) | Columbus, OH |
| 46 | University of Maryland &, College Park | 30,353 (fall 2022) | $40,306 (out-of-state)$11,505 (in-state) | College Park, MD |
| 47 | Virginia Tech | 30,434 (fall 2022) | $36,090 (out-of-state)$15,478 (in-state) | Blacksburg, VA |
| 47 | University of Georgia | 30,714 (fall 2022) | $30,220 (out-of-state)$11,180 (in-state) | Athens, GA |
| 47 | Wake Forest University | 5,447 (fall 2022) | $64,758 | Winston-Salem, NC |
| 47 | Lehigh University | 5,624 (fall 2022) | $62,180 | Bethlehem, PA |
| 47 | Texas A&M University | 57,512 (fall 2022) | $40,607 (out-of-state)$12,413 (in-state) | College Station, TX |
| 47 | University of Rochester | 6,767 (fall 2022) | $64,384 | Rochester, NY |
| 53 | Northeastern University | 16,302 (fall 2022) | $63,141 | Boston, MA |
| 53 | Florida State University | 32,936 (fall 2022) | $21,683 (out-of-state)$6,517 (in-state) | Tallahassee, FL |
| 53 | University of Minnesota, Twin Cities | 39,248 (fall 2022) | $36,402 (out-of-state)$16,488 (in-state) | Minneapolis, MN |
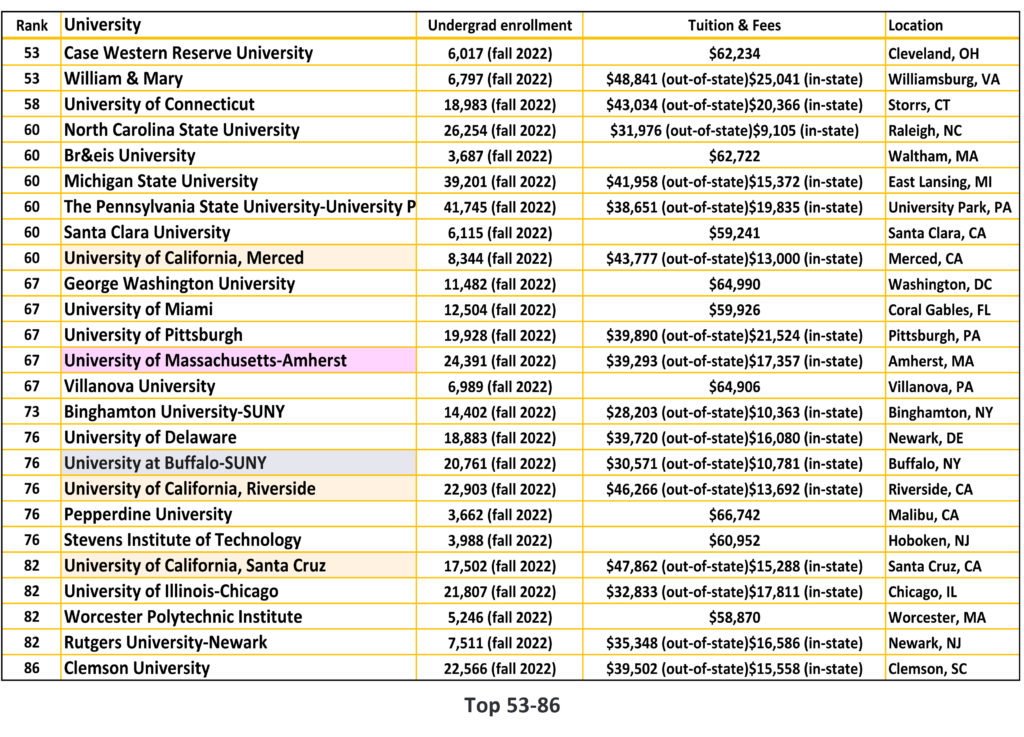
| 53 | Case Western Reserve University | 6,017 (fall 2022) | $62,234 | Cleveland, OH |
| 53 | William & Mary | 6,797 (fall 2022) | $48,841 (out-of-state)$25,041 (in-state) | Williamsburg, VA |
| 58 | University of Connecticut | 18,983 (fall 2022) | $43,034 (out-of-state)$20,366 (in-state) | Storrs, CT |
| 60 | North Carolina State University | 26,254 (fall 2022) | $31,976 (out-of-state)$9,105 (in-state) | Raleigh, NC |
| 60 | Br&eis University | 3,687 (fall 2022) | $62,722 | Waltham, MA |
| 60 | Michigan State University | 39,201 (fall 2022) | $41,958 (out-of-state)$15,372 (in-state) | East Lansing, MI |
| 60 | The Pennsylvania State University-University Park | 41,745 (fall 2022) | $38,651 (out-of-state)$19,835 (in-state) | University Park, PA |
| 60 | Santa Clara University | 6,115 (fall 2022) | $59,241 | Santa Clara, CA |
| 60 | University of California, Merced | 8,344 (fall 2022) | $43,777 (out-of-state)$13,000 (in-state) | Merced, CA |
| 67 | George Washington University | 11,482 (fall 2022) | $64,990 | Washington, DC |
| 67 | University of Miami | 12,504 (fall 2022) | $59,926 | Coral Gables, FL |
| 67 | University of Pittsburgh | 19,928 (fall 2022) | $39,890 (out-of-state)$21,524 (in-state) | Pittsburgh, PA |
| 67 | University of Massachusetts-Amherst | 24,391 (fall 2022) | $39,293 (out-of-state)$17,357 (in-state) | Amherst, MA |
| 67 | Villanova University | 6,989 (fall 2022) | $64,906 | Villanova, PA |
| 73 | Binghamton University-SUNY | 14,402 (fall 2022) | $28,203 (out-of-state)$10,363 (in-state) | Binghamton, NY |
| 76 | University of Delaware | 18,883 (fall 2022) | $39,720 (out-of-state)$16,080 (in-state) | Newark, DE |
| 76 | University at Buffalo-SUNY | 20,761 (fall 2022) | $30,571 (out-of-state)$10,781 (in-state) | Buffalo, NY |
| 76 | University of California, Riverside | 22,903 (fall 2022) | $46,266 (out-of-state)$13,692 (in-state) | Riverside, CA |
| 76 | Pepperdine University | 3,662 (fall 2022) | $66,742 | Malibu, CA |
| 76 | Stevens Institute of Technology | 3,988 (fall 2022) | $60,952 | Hoboken, NJ |
| 82 | University of California, Santa Cruz | 17,502 (fall 2022) | $47,862 (out-of-state)$15,288 (in-state) | Santa Cruz, CA |
| 82 | University of Illinois-Chicago | 21,807 (fall 2022) | $32,833 (out-of-state)$17,811 (in-state) | Chicago, IL |
| 82 | Worcester Polytechnic Institute | 5,246 (fall 2022) | $58,870 | Worcester, MA |
| 82 | Rutgers University-Newark | 7,511 (fall 2022) | $35,348 (out-of-state)$16,586 (in-state) | Newark, NJ |
| 86 | Clemson University | 22,566 (fall 2022) | $39,502 (out-of-state)$15,558 (in-state) | Clemson, SC |
| 86 | Marquette University | 7,528 (fall 2022) | $48,700 | Milwaukee, WI |
| 86 | New Jersey Institute of Technology | 9,019 (fall 2022) | $34,972 (out-of-state)$18,512 (in-state) | Newark, NJ |
| 89 | Fordham University | 10,098 (fall 2022) | $61,567 | New York, NY |
| 89 | Temple University | 24,106 (fall 2022) | $35,956 (out-of-state)$21,095 (in-state) | Philadelphia, PA |
| 89 | University of South Florida | 38,046 (fall 2022) | $17,324 (out-of-state)$6,410 (in-state) | Tampa, FL |
| 89 | Southern Methodist University | 7,056 (fall 2022) | $64,460 | Dallas, TX |
| 93 | Baylor University | 15,213 (fall 2022) | $54,844 | Waco, TX |
| 93 | Auburn University | 25,379 (fall 2022) | $33,944 (out-of-state)$12,536 (in-state) | Auburn, AL |
| 93 | Gonzaga University | 5,084 (fall 2022) | $53,500 | Spokane, WA |
| 98 | Texas Christian University | 10,523 (fall 2022) | $57,220 | Fort Worth, TX |
| 98 | Drexel University | 12,482 (fall 2022) | $60,663 | Philadelphia, PA |
| 98 | University of Oregon | 19,565 (fall 2022) | $41,194 (out-of-state)$14,751 (in-state) | Eugene, OR |
| 98 | Illinois Institute of Technology | 3,125 (fall 2022) | $51,763 | Chicago, IL |
| 98 | Rutgers University-Camden | 4,185 (fall 2022) | $35,841 (out-of-state)$17,079 (in-state) | Camden, NJ |
| 98 | University of San Diego | 5,669 (fall 2022) | $56,444 | San Diego, CA |
| 105 | CUNY-City College | 11,929 (fall 2022) | $19,010 (out-of-state)$7,340 (in-state) | New York, NY |
| 105 | George Mason University | 27,014 (fall 2022) | $37,976 (out-of-state)$13,812 (in-state) | Fairfax, VA |
| 105 | University of Tennessee, Knoxville | 27,039 (fall 2022) | $31,434 (out-of-state)$13,244 (in-state) | Knoxville, TN |
| 105 | University of Colorado Boulder | 31,103 (fall 2022) | $41,966 (out-of-state)$13,622 (in-state) | Boulder, CO |
| 105 | California State University-Long Beach | 32,711 (fall 2022) | $17,200 (out-of-state)$6,904 (in-state) | Long Beach, CA |
| 105 | Arizona State University | 65,492 (fall 2022) | $32,193 (out-of-state)$12,051 (in-state) | Tempe, AZ |
| 105 | Saint Louis University | 7,426 (fall 2022) | $53,244 | St. Louis, MO |
| 105 | American University | 7,917 (fall 2022) | $56,544 | Washington, DC |
| 115 | SUNY College of Environmental Science & Forestry | 1,621 (fall 2022) | $21,036 (out-of-state)$9,206 (in-state) | Syracuse, NY |
| 115 | University of New Hampshire | 11,480 (fall 2022) | $38,882 (out-of-state)$19,112 (in-state) | Durham, NH |
| 115 | The University of Texas at Dallas | 21,617 (fall 2022) | $44,812 (out-of-state)$16,412 (in-state) | Richardson, TX |
| 115 | Iowa State University of Science & Technology | 25,241 (fall 2022) | $26,617 (out-of-state)$10,133 (in-state) | Ames, IA |
| 115 | University of Utah | 26,355 (fall 2022) | $33,045 (out-of-state)$10,287 (in-state) | Salt Lake City, UT |
| 115 | Brigham Young University | 31,401 (fall 2022) | $6,496 | Provo, UT |
| 115 | University of San Francisco | 6,018 (fall 2022) | $58,222 | San Francisco, CA |
| 115 | Howard University | 9,809 (fall 2022) | $33,344 | Washington, DC |
| 124 | James Madison University | 20,346 (fall 2022) | $30,790 (out-of-state)$13,576 (in-state) | Harrisonburg, VA |
| 124 | University of Oklahoma | 21,294 (fall 2022) | $25,880 (out-of-state)$9,312 (in-state) | Norman, OK |
| 124 | University of Missouri | 23,752 (fall 2022) | $34,322 (out-of-state)$14,122 (in-state) | Columbia, MO |
| 124 | University of South Carolina | 27,343 (fall 2022) | $33,928 (out-of-state)$12,688 (in-state) | Columbia, SC |
| 124 | Fairfield University | 4,757 (fall 2022) | $56,360 | Fairfield, CT |
| 124 | Florida International University | 45,442 (fall 2022) | $18,964 (out-of-state)$6,566 (in-state) | Miami, FL |
| 124 | University of Central Florida | 58,749 (fall 2022) | $22,467 (out-of-state)$6,368 (in-state) | Orlando, FL |
| 124 | University of Denver | 6,160 (fall 2022) | $59,340 | Denver, CO |
| 133 | University of Maryl&, Baltimore County | 10,625 (fall 2022) | $30,308 (out-of-state)$12,952 (in-state) | Baltimore, MD |
| 133 | University of Vermont | 11,898 (fall 2022) | $43,890 (out-of-state)$18,890 (in-state) | Burlington, VT |
| 133 | University at Albany-SUNY | 12,264 (fall 2022) | $28,998 (out-of-state)$10,408 (in-state) | Albany, NY |
| 133 | Miami University-Oxford | 16,865 (fall 2022) | $38,127 (out-of-state)$17,055 (in-state) | Oxford, OH |
| 133 | California State University-Fullerton | 35,239 (fall 2022) | $18,954 (out-of-state)$7,074 (in-state) | Fullerton, CA |
| 133 | University of Houston | 37,943 (fall 2022) | $27,110 (out-of-state)$11,870 (in-state) | Houston, TX |
| 133 | Elon University | 6,337 (fall 2022) | $44,536 | Elon, NC |
| 133 | Chapman University | 7,869 (fall 2022) | $62,784 | Orange, CA |
| 133 | University of Dayton | 8,416 (fall 2022) | $47,600 | Dayton, OH |
| 142 | Loyola University Chicago | 11,703 (fall 2022) | $51,706 | Chicago, IL |
| 142 | University of Alabama at Birmingham | 13,032 (fall 2022) | $26,520 (out-of-state)$11,040 (in-state) | Birmingham, AL |
| 142 | Clark University | 2,389 (fall 2022) | $55,187 | Worcester, MA |
| 142 | Clarkson University | 2,668 (fall 2022) | $57,950 | Potsdam, NY |
| 142 | Oregon State University | 28,905 (fall 2022) | $35,664 (out-of-state)$13,494 (in-state) | Corvallis, OR |
| 142 | University of Cincinnati | 29,989 (fall 2022) | $27,140 (out-of-state)$13,530 (in-state) | Cincinnati, OH |
| 142 | University of the Pacific | 3,294 (fall 2022) | $55,340 | Stockton, CA |
| 142 | Thomas Jefferson University | 3,771 (fall 2022) | $45,733 | Philadelphia, PA |
| 151 | Simmons University | 1,789 (fall 2022) | $45,538 | Boston, MA |
| 151 | University of Rhode Isl& | 13,927 (fall 2022) | $35,804 (out-of-state)$16,408 (in-state) | Kingston, RI |
| 151 | University of Kansas | 19,241 (fall 2022) | $28,035 (out-of-state)$11,167 (in-state) | Lawrence, KS |
| 151 | Colorado State University | 26,062 (fall 2022) | $33,752 (out-of-state)$12,896 (in-state) | Fort Collins, CO |
| 151 | Duquesne University | 5,095 (fall 2022) | $47,146 | Pittsburgh, PA |
| 151 | Michigan Technological University | 5,710 (fall 2022) | $41,340 (out-of-state)$18,392 (in-state) | Houghton, MI |
| 159 | University of Massachusetts-Lowell | 12,391 (fall 2022) | $35,396 (out-of-state)$16,570 (in-state) | Lowell, MA |
| 159 | University of Nebraska – Lincoln | 19,189 (fall 2022) | $27,748 (out-of-state)$10,108 (in-state) | Lincoln, NE |
| 159 | University of Kentucky | 22,735 (fall 2022) | $33,406 (out-of-state)$13,212 (in-state) | Lexington, KY |
| 159 | Stockton University | 8,138 (fall 2022) | $23,420 (out-of-state)$15,532 (in-state) | Galloway, NJ |
| 163 | Rowan University | 15,264 (fall 2022) | $25,564 (out-of-state)$15,700 (in-state) | Glassboro, NJ |
| 163 | Montclair State University | 17,290 (fall 2022) | $22,470 (out-of-state)$14,767 (in-state) | Montclair, NJ |
| 163 | University of Mississippi | 17,302 (fall 2022) | $26,980 (out-of-state)$9,412 (in-state) | University, MS |
| 163 | Seattle University | 4,099 (fall 2022) | $54,285 | Seattle, WA |
| 163 | Adelphi University | 5,055 (fall 2022) | $47,290 | Garden City, NY |
| 163 | University of St. Thomas (MN) | 5,942 (fall 2022) | $52,284 | St. Paul, MN |
| 170 | University of Hawaii at Manoa | 14,198 (fall 2022) | $34,218 (out-of-state)$12,186 (in-state) | Honolulu, HI |
| 170 | Kansas State University | 15,046 (fall 2022) | $27,816 (out-of-state)$10,942 (in-state) | Manhattan, KS |
| 170 | California State University-San Bernardino | 16,813 (fall 2022) | $14,311 (out-of-state)$7,679 (in-state) | San Bernardino, CA |
| 170 | The University of Alabama | 32,458 (fall 2022) | $33,200 (out-of-state)$11,900 (in-state) | Tuscaloosa, AL |
| 170 | Mercer University | 4,859 (fall 2022) | $40,890 | Macon, GA |
| 170 | Quinnipiac University | 6,073 (fall 2022) | $53,090 | Hamden, CT |
| 170 | Florida A&M University | 7,709 (fall 2022) | $17,725 (out-of-state)$5,785 (in-state) | Tallahassee, FL |
| 178 | Ohio University | 17,860 (fall 2022) | $24,114 (out-of-state)$13,746 (in-state) | Athens, OH |
| 178 | Drake University | 2,835 (fall 2022) | $50,114 | Des Moines, IA |
| 178 | San Francisco State University | 21,868 (fall 2022) | $19,404 (out-of-state)$7,524 (in-state) | San Francisco, CA |
| 178 | Washington State University | 22,612 (fall 2022) | $29,073 (out-of-state)$12,997 (in-state) | Pullman, WA |
| 178 | University of North Carolina-Charlotte | 23,461 (fall 2022) | $21,338 (out-of-state)$7,214 (in-state) | Charlotte, NC |
| 178 | University of Arkansas | 26,269 (fall 2022) | $28,772 (out-of-state)$9,748 (in-state) | Fayetteville, AR |
| 185 | St. John Fisher University | 2,629 (fall 2022) | $39,666 | Rochester, NY |
| 185 | Oklahoma State University | 20,801 (fall 2022) | $24,764 (out-of-state)$9,244 (in-state) | Stillwater, OK |
| 185 | California State University, Fresno | 21,305 (fall 2022) | $13,112 (out-of-state)$6,974 (in-state) | Fresno, CA |
| 185 | University of Detroit Mercy | 3,156 (fall 2022) | $31,058 | Detroit, MI |
| 185 | Samford University | 3,672 (fall 2022) | $38,144 | Birmingham, AL |
| 185 | Louisiana State University-Baton Rouge | 30,952 (fall 2022) | $28,631 (out-of-state)$11,954 (in-state) | Baton Rouge, LA |
| 185 | Bradley University | 4,143 (fall 2022) | $39,680 | Peoria, IL |
| 185 | Missouri University of Science & Technology | 5,501 (fall 2022) | $31,862 (out-of-state)$14,462 (in-state) | Rolla, MO |
| 185 | Hofstra University | 6,110 (fall 2022) | $55,450 | Hempstead, NY |
| 195 | Russell Sage College | 1,126 (fall 2022) | $36,756 | Troy, NY |
| 195 | University of Louisville | 15,921 (fall 2022) | $29,174 (out-of-state)$12,828 (in-state) | Louisville, KY |
| 195 | University of Nevada, Reno | 16,973 (fall 2022) | $25,950 (out-of-state)$8,994 (in-state) | Reno, NV |
| 195 | University of Tulsa | 2,647 (fall 2022) | $48,102 | Tulsa, OK |
| 195 | East Carolina University | 21,688 (fall 2022) | $23,602 (out-of-state)$7,325 (in-state) | Greenville, NC |
| 195 | Touro University | 4,860 (fall 2022) | $21,810 | New York, NY |
| 201 | University of North Carolina-Wilmington | 14,294 (fall 2022) | $22,985 (out-of-state)$7,317 (in-state) | Wilmington, NC |
| 201 | Wayne State University | 16,116 (fall 2022) | $31,614 (out-of-state)$14,925 (in-state) | Detroit, MI |
| 201 | Indiana University-Purdue University-Indianapolis | 17,727 (fall 2022) | $33,717 (out-of-state)$10,449 (in-state) | Indianapolis, IN |
| 201 | Valparaiso University | 2,349 (fall 2022) | $46,588 | Valparaiso, IN |
| 201 | La Salle University | 2,776 (fall 2022) | $35,520 | Philadelphia, PA |
| 201 | Robert Morris University | 2,782 (fall 2022) | $34,740 | Moon Township, PA |
| 201 | Xavier University | 4,860 (fall 2022) | $48,125 | Cincinnati, OH |
| 201 | The New School | 7,208 (fall 2022) | $56,244 | New York, NY |
| 209 | Chatham University | 1,499 (fall 2022) | $43,810 | Pittsburgh, PA |
| 209 | West Chester University of Pennsylvania | 14,392 (fall 2022) | $22,261 (out-of-state)$10,687 (in-state) | West Chester, PA |
| 209 | Illinois State University | 18,055 (fall 2022) | $27,011 (out-of-state)$15,171 (in-state) | Normal, IL |
| 209 | University of Massachusetts-Dartmouth | 5,517 (fall 2022) | $30,992 (out-of-state)$14,854 (in-state) | North Dartmouth, MA |
| 216 | The College of St. Scholastica | 1,938 (fall 2022) | $40,454 | Duluth, MN |
| 216 | University of Massachusetts-Boston | 12,221 (fall 2022) | $37,211 (out-of-state)$15,535 (in-state) | Boston, MA |
| 216 | University of North Carolina at Greensboro | 14,198 (fall 2022) | $22,539 (out-of-state)$7,379 (in-state) | Greensboro, NC |
| 216 | Ball State University | 14,416 (fall 2022) | $28,766 (out-of-state)$10,758 (in-state) | Muncie, IN |
| 216 | Mississippi State University | 18,305 (fall 2022) | $26,580 (out-of-state)$9,815 (in-state) | Mississippi State, MS |
| 216 | Springfield College | 2,005 (fall 2022) | $43,707 | Springfield, MA |
| 216 | St. Catherine University | 2,416 (fall 2022) | $49,758 | St. Paul, MN |
| 216 | University of St. Thomas (TX) | 2,729 (fall 2022) | $33,660 | Houston, TX |
| 216 | University of Wyoming | 8,518 (fall 2022) | $22,718 (out-of-state)$6,938 (in-state) | Laramie, WY |
| 227 | Misericordia University | 1,777 (fall 2022) | $38,370 | Dallas, PA |
| 227 | Widener University | 2,555 (fall 2022) | $53,638 | Chester, PA |
| 227 | Kent State University | 20,418 (fall 2022) | $22,316 (out-of-state)$12,846 (in-state) | Kent, OH |
| 227 | Georgia State University | 28,927 (fall 2022) | $29,306 (out-of-state)$10,268 (in-state) | Atlanta, GA |
| 227 | Nova Southeastern University | 6,971 (fall 2022) | $37,080 | Ft. Lauderdale, FL |
| 227 | University of Alabama at Huntsville | 7,169 (fall 2022) | $24,770 (out-of-state)$11,878 (in-state) | Huntsville, AL |
| 227 | Western Carolina University | 9,956 (fall 2022) | $8,532 (out-of-state)$4,532 (in-state) | Cullowhee, NC |
| 227 | University of Puerto Rico-Rio Piedras | N/A | $2,168 (out-of-state)$5,324 (in-state) | Rio Piedras, PR |
| 236 | University of North Florida | 14,171 (fall 2022) | $20,107 (out-of-state)$6,398 (in-state) | Jacksonville, FL |
| 236 | University of New Mexico | 15,914 (fall 2022) | $26,452 (out-of-state)$10,092 (in-state) | Albuquerque, NM |
| 236 | Western New Engl& University | 2,406 (fall 2022) | $46,430 | Springfield, MA |
| 236 | Bethel University (MN) | 2,533 (fall 2022) | $42,930 | St. Paul, MN |
| 236 | Azusa Pacific University | 2,588 (fall 2022) | $42,330 | Azusa, CA |
| 236 | Lipscomb University | 2,955 (fall 2022) | $38,824 | Nashville, TN |
| 236 | Biola University | 3,499 (fall 2022) | $46,704 | La Mirada, CA |
| 236 | The University of Texas at Arlington | 30,791 (fall 2022) | $29,660 (out-of-state)$11,728 (in-state) | Arlington, TX |
| 236 | Belmont University | 7,376 (fall 2022) | $41,320 | Nashville, TN |
| 236 | University of North Dakota | 9,928 (fall 2022) | $15,570 (out-of-state)$10,951 (in-state) | Grand Forks, ND |
| 236 | Gallaudet University | 914 (fall 2022) | $18,254 | Washington, DC |
| 249 | Union University | 1,899 (fall 2022) | $38,300 | Jackson, TN |
| 249 | North Dakota State University | 10,096 (fall 2022) | $15,646 (out-of-state)$10,992 (in-state) | Fargo, ND |
| 249 | Keiser University | 16,960 (fall 2022) | $36,020 | Ft. Lauderdale, FL |
| 249 | Sam Houston State University | 18,235 (fall 2022) | $22,996 (out-of-state)$10,756 (in-state) | Huntsville, TX |
| 249 | Northern Arizona University | 23,207 (fall 2022) | $28,900 (out-of-state)$12,654 (in-state) | Flagstaff, AZ |
| 249 | Suffolk University | 4,437 (fall 2022) | $45,380 | Boston, MA |
| 249 | Maryville University of St. Louis | 5,809 (fall 2022) | $27,166 | St Louis, MO |
| 249 | Pace University | 8,223 (fall 2022) | $51,424 | New York, NY |
| 249 | Tennessee Tech University | 8,537 (fall 2022) | $15,030 (out-of-state)$10,830 (in-state) | Cookeville, TN |
| 249 | University of Wisconsin-La Crosse | 9,352 (fall 2022) | $18,814 (out-of-state)$9,774 (in-state) | La Crosse, WI |
| 249 | University of Maine | 9,774 (fall 2022) | $35,346 (out-of-state)$12,606 (in-state) | Orono, ME |
| 260 | Gwynedd Mercy University | 1,412 (fall 2022) | $38,310 | Gwynedd Valley, PA |
| 260 | Central Michigan University | 10,421 (fall 2022) | $14,790 (out-of-state)$14,790 (in-state) | Mount Pleasant, MI |
| 260 | University of Missouri-St. Louis | 12,431 (fall 2022) | $31,516 (out-of-state)$12,648 (in-state) | St. Louis, MO |
| 260 | Regis University | 2,398 (fall 2022) | $43,980 | Denver, CO |
| 260 | Gannon University | 2,991 (fall 2022) | $36,676 | Erie, PA |
| 260 | Loyola University New Orleans | 3,289 (fall 2022) | $47,240 | New Orleans, LA |
| 260 | University of New Engl& | 3,718 (fall 2022) | $42,550 | Biddeford, ME |
| 260 | University of North Texas | 33,024 (fall 2022) | $24,644 (out-of-state)$12,044 (in-state) | Denton, TX |
| 260 | Winston-Salem State University | N/A | $16,932 (out-of-state)$6,276 (in-state) | Winston-Salem, NC |
| 269 | Lincoln Memorial University | 1,560 (fall 2022) | $26,150 | Harrogate, TN |
| 269 | University of Missouri-Kansas City | 10,190 (fall 2022) | $30,734 (out-of-state)$12,734 (in-state) | Kansas City, MO |
| 269 | Northern Illinois University | 11,429 (fall 2022) | $12,504 (out-of-state)$12,504 (in-state) | DeKalb, IL |
| 269 | Seattle Pacific University | 2,428 (fall 2022) | $38,814 | Seattle, WA |
| 269 | Utah State University | 24,835 (fall 2022) | $24,802 (out-of-state)$9,228 (in-state) | Logan, UT |
| 269 | University of Nevada, Las Vegas | 25,365 (fall 2022) | $26,099 (out-of-state)$9,143 (in-state) | Las Vegas, NV |
| 269 | University of South Dakota | 7,132 (fall 2022) | $12,942 (out-of-state)$9,432 (in-state) | Vermillion, SD |
| 280 | Oklahoma City University | 1,361 (fall 2022) | $33,586 | Oklahoma City, OK |
| 280 | University of St. Francis | 1,417 (fall 2022) | $37,000 | Joliet, IL |
| 280 | Immaculata University | 1,508 (fall 2022) | $28,550 | Immaculata, PA |
| 280 | North Carolina Agricultural & Technical State University | 11,833 (fall 2022) | $20,243 (out-of-state)$6,733 (in-state) | Greensboro, NC |
| 280 | University of Toledo | 11,965 (fall 2022) | $21,280 (out-of-state)$11,920 (in-state) | Toledo, OH |
| 280 | Bowling Green State University | 13,853 (fall 2022) | $21,424 (out-of-state)$13,436 (in-state) | Bowling Green, OH |
| 280 | Portl& State University | 16,864 (fall 2022) | $24,495 (out-of-state)$9,375 (in-state) | Portland, OR |
| 280 | Old Dominion University | 18,375 (fall 2022) | $32,662 (out-of-state)$12,262 (in-state) | Norfolk, VA |
| 280 | DeSales University | 2,231 (fall 2022) | $44,800 | Center Valley, PA |
| 280 | Bellarmine University | 2,343 (fall 2022) | $46,780 | Louisville, KY |
| 280 | Hampton University | 2,794 (fall 2022) | $29,312 | Hampton, VA |
| 280 | Marian University (IN) | 2,860 (fall 2022) | $39,100 | Indianapolis, IN |
| 280 | Texas State University | 33,834 (fall 2022) | $24,447 (out-of-state)$12,207 (in-state) | San Marcos, TX |
| 280 | Clarke University | 785 (fall 2022) | $39,600 | Dubuque, IA |
| 280 | Southern Illinois University-Carbondale | 8,000 (fall 2022) | $15,522 (out-of-state)$15,522 (in-state) | Carbondale, IL |
| 296 | New Mexico State University | 11,591 (fall 2022) | $27,385 (out-of-state)$9,058 (in-state) | Las Cruces, NM |
| 296 | Alvernia University | 2,018 (fall 2022) | $42,810 | Reading, PA |
| 296 | South Dakota State University | 9,921 (fall 2022) | $12,809 (out-of-state)$9,299 (in-state) | Brookings, SD |
| 296 | California State University-East Bay | N/A | $18,875 (out-of-state)$6,995 (in-state) | Hayward, CA |
| 296 | Pontifical Catholic University of Puerto Rico-Ponce | N/A | $5,920 | Ponce, PR |
| 296 | Southeastern Baptist Theological Seminary | N/A | $10,234 | Wake Forest, NC |
| 304 | Louisiana Tech University | 10,083 (fall 2022) | $19,608 (out-of-state)$10,695 (in-state) | Ruston, LA |
| 304 | Florida Gulf Coast University | 14,137 (fall 2022) | $25,161 (out-of-state)$6,118 (in-state) | Fort Myers, FL |
| 304 | Concordia University Wisconsin | 2,817 (fall 2022) | $34,250 | Mequon, WI |
| 304 | Harding University | 3,523 (fall 2022) | $24,888 | Searcy, AR |
| 304 | Ferris State University | 9,000 (fall 2022) | $14,686 (out-of-state)$14,686 (in-state) | Big Rapids, MI |
_____________________________________________________________
2021年 National University Rankings
Top 70
| Rank# | Unviersity | Location |
| 1 | Princeton University | Princeton, NJ |
| 2 | Harvard University | Cambridge, MA |
| 3 | Columbia University | New York, NY |
| 4 | Massachusetts Institute of Technology | Cambridge, MA |
| 4 | Yale University | New Haven, CT |
| 6 | University of Chicago | Chicago, IL |
| 6 | Stanford University | Stanford, CA |
| 8 | University of Pennsylvania | Philadelphia, PA |
| 9 | California Institute of Technology | Pasadena, CA |
| 9 | Johns Hopkins University | Baltimore, MD |
| 9 | Northwestern University | Evanston, IL |
| 12 | Duke University | Durham, NC |
| 13 | Dartmouth College | Hanover, NH |
| 14 | Vanderbilt University | Nashville, TN |
| 14 | Brown University | Providence, RI |
| 16 | Rice University | Houston, TX |
| 16 | Washington University in St. Louis | St. Louis, MO |
| 18 | Cornell University | Ithaca, NY |
| 19 | University of Notre Dame | Notre Dame, IN |
| 20 | University of California–Los Angeles | Los Angeles, CA |
| 21 | Emory University | Atlanta, GA |
| 22 | University of California–Berkeley | Berkeley, CA |
| 23 | Georgetown University | Washington, DC |
| 24 | University of Michigan–Ann Arbor | Ann Arbor, MI |
| 24 | University of Southern California | Los Angeles, CA |
| 26 | University of Virginia | Charlottesville, VA |
| 26 | Carnegie Mellon University | Pittsburgh, PA |
| 28 | University of North Carolina–Chapel Hill | Chapel Hill, NC |
| 28 | Wake Forest University | Winston-Salem, NC |
| 30 | University of California–Santa Barbara | Santa Barbara, CA |
| 30 | University of Florida | Gainesville, FL |
| 30 | Tufts University | Medford, MA |
| 30 | New York University | New York, NY |
| 34 | University of Rochester | Rochester, NY |
| 35 | Georgia Institute of Technology | Atlanta, GA |
| 35 | University of California–Irvine | Irvine, CA |
| 35 | University of California–San Diego | La Jolla, CA |
| 35 | Boston College | Chestnut Hill, MA |
| 39 | University of California–Davis | Davis, CA |
| 39 | William & Mary | Williamsburg, VA |
| 41 | Tulane University | New Orleans, LA |
| 42 | University of Texas at Austin | Austin, TX |
| 42 | University of Wisconsin–Madison | Madison, WI |
| 42 | Brandeis University | Waltham, MA |
| 42 | Case Western Reserve University | Cleveland, OH |
| 42 | Boston University | Boston, MA |
| 47 | University of Georgia | Athens, GA |
| 47 | University of Illinois–Urbana-Champaign | Champaign, IL |
| 49 | Pepperdine University | Malibu, CA |
| 49 | Lehigh University | Bethlehem, PA |
| 49 | University of Miami | Coral Gables, FL |
| 49 | Northeastern University | Boston, MA |
| 53 | Ohio State University–Columbus | Columbus, OH |
| 53 | Purdue University–West Lafayette | West Lafayette, IN |
| 53 | Santa Clara University | Santa Clara, CA |
| 53 | Rensselaer Polytechnic Institute | Troy, NY |
| 53 | Villanova University | Villanova, PA |
| 58 | Florida State University | Tallahassee, FL |
| 58 | University of Maryland–College Park | College Park, MD |
| 58 | University of Pittsburgh–Pittsburgh Campus | Pittsburgh, PA |
| 58 | University of Washington | Seattle, WA |
| 58 | Syracuse University | Syracuse, NY |
| 63 | Pennsylvania State University–University Park | University Park, PA |
| 63 | Rutgers University–New Brunswick | Piscataway, NJ |
| 63 | University of Connecticut | Storrs, CT |
| 66 | Texas A&M University | College Station, TX |
| 66 | University of Massachusetts–Amherst | Amherst, MA |
| 66 | University of Minnesota–Twin Cities | Minneapolis, MN |
| 66 | Worcester Polytechnic Institute | Worcester, MA |
| 66 | Southern Methodist University | Dallas, TX |
| 66 | Loyola Marymount University | Los Angeles, CA |
| 66 | Fordham University | New York, NY |
| 66 | George Washington University | Washington, DC |
70-200
| 74 | Clemson University | Clemson, SC |
| 74 | Virginia Tech | Blacksburg, VA |
| 76 | Indiana University–Bloomington | Bloomington, IN |
| 76 | Yeshiva University | New York, NY |
| 76 | American University | Washington, DC |
| 76 | Baylor University | Waco, TX |
| 80 | Michigan State University | East Lansing, MI |
| 80 | North Carolina State University | Raleigh, NC |
| 80 | Stevens Institute of Technology | Hoboken, NJ |
| 80 | Gonzaga University | Spokane, WA |
| 80 | University of Denver | Denver, CO |
| 80 | Howard University | Washington, DC |
| 80 | Texas Christian University | Fort Worth, TX |
| 80 | Brigham Young University–Provo | Provo, UT |
| 88 | Binghamton University–SUNY | Binghamton, NY |
| 88 | Colorado School of Mines | Golden, CO |
| 88 | Stony Brook University–SUNY | Stony Brook, NY |
| 88 | University at Buffalo–SUNY | Buffalo, NY |
| 88 | University of California–Riverside | Riverside, CA |
| 88 | University of Iowa | Iowa City, IA |
| 88 | University of San Diego | San Diego, CA |
| 88 | Elon University | Elon, NC |
| 88 | Marquette University | Milwaukee, WI |
| 97 | Auburn University | Auburn, AL |
| 97 | University of Arizona | Tucson, AZ |
| 97 | University of California–Merced | Merced, CA |
| 97 | University of California–Santa Cruz | Santa Cruz, CA |
| 97 | University of Delaware | Newark, DE |
| 97 | University of Utah | Salt Lake City, UT |
| 103 | Arizona State University–Tempe | Tempe, AZ |
| 103 | Miami University–Oxford | Oxford, OH |
| 103 | Temple University | Philadelphia, PA |
| 103 | University of Colorado Boulder | Boulder, CO |
| 103 | University of Oregon | Eugene, OR |
| 103 | University of South Florida | Tampa, FL |
| 103 | Clark University | Worcester, MA |
| 103 | University of San Francisco | San Francisco, CA |
| 103 | Saint Louis University | St. Louis, MO |
| 112 | University of Illinois–Chicago | Chicago, IL |
| 112 | University of Tennessee | Knoxville, TN |
| 112 | University of La Verne | La Verne, CA |
| 112 | Creighton University | Omaha, NE |
| 112 | Loyola University Chicago | Chicago, IL |
| 112 | Rochester Institute of Technology | Rochester, NY |
| 118 | Iowa State University | Ames, IA |
| 118 | New Jersey Institute of Technology | Newark, NJ |
| 118 | Rutgers University–Newark | Newark, NJ |
| 118 | SUNY College of Environmental Science and Forestry | Syracuse, NY |
| 118 | University of South Carolina | Columbia, SC |
| 118 | University of Vermont | Burlington, VT |
| 124 | University of Missouri | Columbia, MO |
| 124 | Gallaudet University | Washington, DC |
| 124 | Drake University | Des Moines, IA |
| 124 | Clarkson University | Potsdam, NY |
| 124 | Illinois Institute of Technology | Chicago, IL |
| 124 | Seattle University | Seattle, WA |
| 124 | Chapman University | Orange, CA |
| 124 | DePaul University | Chicago, IL |
| 124 | University of Kansas | Lawrence, KS |
| 133 | The New School | New York, NY |
| 133 | University of Kentucky | Lexington, KY |
| 133 | University of Nebraska–Lincoln | Lincoln, NE |
| 133 | University of Oklahoma | Norman, OK |
| 133 | Simmons University | Boston, MA |
| 133 | University of the Pacific | Stockton, CA |
| 133 | Seton Hall University | South Orange, NJ |
| 133 | University of St. Thomas (MN) | St. Paul, MN |
| 133 | University of Dayton | Dayton, OH |
| 133 | Drexel University | Philadelphia, PA |
| 143 | George Mason University | Fairfax, VA |
| 143 | Samford University | Birmingham, AL |
| 143 | San Diego State University | San Diego, CA |
| 143 | University of Alabama | Tuscaloosa, AL |
| 143 | University of Cincinnati | Cincinnati, OH |
| 143 | University of New Hampshire | Durham, NH |
| 143 | University of Texas at Dallas | Richardson, TX |
| 143 | University of Tulsa | Tulsa, OK |
| 143 | The Catholic University of America | Washington, DC |
| 143 | Duquesne University | Pittsburgh, PA |
| 153 | Colorado State University | Fort Collins, CO |
| 153 | Louisiana State University–Baton Rouge | Baton Rouge, LA |
| 153 | Oregon State University | Corvallis, OR |
| 153 | University of Alabama at Birmingham | Birmingham, AL |
| 153 | Michigan Technological University | Houghton, MI |
| 153 | Rutgers University–Camden | Camden, NJ |
| 153 | Quinnipiac University | Hamden, CT |
| 160 | University at Albany–SUNY | Albany, NY |
| 160 | University of Arkansas | Fayetteville, AR |
| 160 | University of Central Florida | Orlando, FL |
| 160 | University of Maryland–Baltimore County | Baltimore, MD |
| 160 | University of Mississippi | University, MS |
| 160 | Virginia Commonwealth University | Richmond, VA |
| 160 | Valparaiso University | Valparaiso, IN |
| 160 | Mercer University | Macon, GA |
| 160 | Hofstra University | Hempstead, NY |
| 160 | Belmont University | Nashville, TN |
| 170 | Kansas State University | Manhattan, KS |
| 170 | University of Hawaii–Manoa | Honolulu, HI |
| 170 | University of Idaho | Moscow, ID |
| 170 | University of Rhode Island | Kingston, RI |
| 170 | Adelphi University | Garden City, NY |
| 170 | St. John’s University (NY) | Queens, NY |
| 176 | CUNY–City College | New York, NY |
| 176 | Missouri University of Science and Technology | Rolla, MO |
| 176 | Ohio University | Athens, OH |
| 176 | St. John Fisher College | Rochester, NY |
| 176 | Montclair State University |
Source: https://www.usnews.com/best-colleges/rankings/national-universities
U.S. News & World Report – National University Ranking 2020
U.S. News & World Report just released its 2020 Best Colleges rankings, covering approximately 1400 colleges and universities. For the ninth straight year, Princeton tops the National University list, followed, not unexpectedly, by Harvard in second. Columbia, MIT, and Yale tied for third. Williams College tops the list of National Liberal Arts Colleges, and UCLA is No. 1 among Top Public Schools. All the schools ranked in the top 20 National Universities list in 2020 were in the top 20 in 2019. This rankings inertia stems from both institutional continuity and a largely repetitive methodology.
we have merged the 2020 QS global ranking with the US News National University ranking to give our readers the ranking of the two most accepted university ranking.
| US News 2020 | QS Global 2020 | School | Location |
| 1 | 013 | Princeton University | Princeton, NJ |
| 2 | 003 | Harvard University | Cambridge, MA |
| 3 | 018 | Columbia University | New York, NY |
| 3 | 001 | Massachusetts Institute of Technology (MIT) | Cambridge, MA |
| 3 | 017 | Yale University | New Haven, CT |
| 6 | 002 | Stanford University | Stanford, CA |
| 6 | 010 | University of Chicago | Chicago, IL |
| 6 | 015 | University of Pennsylvania | Philadelphia, PA |
| 9 | 031 | Northwestern University | Evanston, IL |
| 10 | 025 | Duke University | Durham, NC |
| 10 | 024 | Johns Hopkins University | Baltimore, MD |
| 12 | 005 | California Institute of Technology (Caltech) | Pasadena, CA |
| 12 | 207 | Dartmouth College | Hanover, NH |
| 14 | 057 | Brown University | Providence, RI |
| 15 | 210 | University of Notre Dame | Notre Dame, IN |
| 15 | 200 | Vanderbilt University | Nashville, TN |
| 17 | 014 | Cornell University | Ithaca, NY |
| 17 | 085 | Rice University | Houston, TX |
| 19 | 108 | Washington University in St. Louis | St. Louis, MO |
| 20 | 035 | University of California, Los Angeles (UCLA) | Los Angeles, CA |
| 21 | 156 | Emory University | Atlanta, GA |
| 22 | 028 | University of California, Berkeley (UCB) | Berkeley, CA |
| 22 | 129 | University of Southern California | Los Angeles, CA |
| 24 | 226 | Georgetown University | Washington, DC |
| 25 | 048 | Carnegie Mellon University | Pittsburgh, PA |
| 25 | 021 | University of Michigan – Ann Arbor | Ann Arbor, MI |
| 27 | 398 | Wake Forest University | Winston-Salem, NC |
| 28 | 198 | University of Virginia | Charlottesville, VA |
| 29 | 072 | Georgia Institute of Technology | Atlanta, GA |
| 29 | 039 | New York University (NYU) | New York, NY |
| 29 | 253 | Tufts University | Medford, MA |
| 29 | 090 | University of North Carolina – Chapel Hill | Chapel Hill, NC |
| 29 | 170 | University of Rochester | Rochester, NY |
| 34 | 135 | University of California, Santa Barbara (UCSB) | Santa Barbara, CA |
| 34 | 167 | University of Florida | Gainesville, FL |
| 36 | 219 | University of California – Irvine (UCI) | Irvine, CA |
| 37 | 432 | Boston College | Chestnut Hill, MA |
| 37 | 045 | University of California – San Diego (UCSD) | La Jolla, CA |
| 29 | 39 | New York University (NYU) | United States |
| 39 | 104 | University of California – Davis (UCD) | Davis, CA |
| 40 | 098 | Boston University | Boston, MA |
| 40 | 468 | Brandeis University | Waltham, MA |
| 40 | 167 | Case Western Reserve University | Cleveland, OH |
| 40 | 601-650 | College of William and Mary | Williamsburg, VA |
| 40 | 344 | Northeastern University | Boston, MA |
| 40 | 419 | Tulane University | New Orleans, LA |
| 46 | 056 | University of Wisconsin – Madison | Madison, WI |
| 46 | 162 | Villanova University | Villanova, PA |
| 48 | 075 | University of Illinois – Urbana-Champaign (UIUC) | Champaign, IL |
| 48 | 065 | University of Texas – Austin | Austin, TX |
| 50 | 551-560 | Lehigh University | Bethlehem, PA |
| 50 | n/a | Pepperdine University | Malibu, CA |
| 50 | 383 | Rensselaer Polytechnic Institute | Troy, NY |
| 50 | 474 | University of Georgia | Athens, GA |
| 54 | 101 | Ohio State University – Columbus | Columbus, OH |
| 54 | 192 | Santa Clara University | Santa Clara, CA |
| 54 | 581-590 | Syracuse University | Syracuse, NY |
| 14 | 57 | Brown University | United States |
| 57 | 448 | Florida State University | Tallahassee, FL |
| 57 | 093 | Pennsylvania State University – University Park | University Park, PA |
| 57 | 111 | Purdue University – West Lafayette | West Lafayette, IN |
| 57 | 271 | University of Miami | Coral Gables, FL |
| 57 | 140 | University of Pittsburgh | Pittsburgh, PA |
| 62 | 262 | Rutgers University – New Brunswick | Piscataway, NJ |
| 62 | 068 | University of Washington | Seattle, WA |
| 64 | 104 | Loyola Marymount University | Los Angeles, CA |
| 64 | 701-750 | Southern Methodist University | Dallas, TX |
| 64 | 377 | University of Connecticut | Storrs, CT |
| 64 | 136 | University of Maryland – College Park | College Park, MD |
| 64 | 305 | University of Massachusetts – Amherst | Amherst, MA |
| 64 | 601-650 | Worcester Polytechnic Institute | Worcester, MA |
| 70 | 701-750 | Clemson University | Clemson, SC |
| 70 | 336 | George Washington University | Washington, DC |
| 70 | 189 | Texas A&M University – College Station | College Station, TX |
| 70 | 156 | University of Minnesota – Twin Cities | Minneapolis, MN |
| 74 | 801-1000 | Fordham University | New York, NY |
| 74 | 651-700 | Stevens Institute of Technology | Hoboken, NJ |
| 74 | 27 | Virginia Tech | Blacksburg, VA |
| 77 | 601-650 | American University | Washington, DC |
| 77 | 751-800 | Brigham Young University – Provo | Provo, UT |
| 79 | 801-1000 | Baylor University | Waco, TX |
| 79 | 801-1000 | Binghamton University – SUNY | Binghamton, NY |
| 79 | 218 | Gonzaga University | Spokane, WA |
| 79 | 312 | Indiana University – Bloomington | Bloomington, IN |
| 79 | 340 | University at Buffalo – SUNY | Buffalo, NY |
| 84 | 166 | Colorado School of Mines | Golden, CO |
| 84 | 21 | Elon University | Elon, NC |
| 84 | 801-1000 | Marquette University | Milwaukee, WI |
| 84 | 144 | Michigan State University | East Lansing, MI |
| 84 | 285 | North Carolina State University – Raleigh | Raleigh, NC |
| 84 | 367 | University of California – Santa Cruz | Santa Cruz, CA |
| 84 | 421 | University of Iowa | Iowa City, IA |
The 2020 list
U.S. News & World Report implemented new ranking criteria that heavily weigh social mobility and graduation outcomes. The rankings compare bachelor’s degree-granting institutions from across the U.S. on 15 diverse measures of academic quality. They can help you craft a shortlist of places in which to dig deeper.
The publication evaluates schools based on the following – Student outcomes (including the new Social mobility factor), Student excellence, Faculty resources, Expert opinion, Financial resources, Alumni giving.
California
UC Berkeley had returned to a top-25 position on the national list (No. 22), after UCLA. (No. 20). Stanford tied with the University of Chicago and the University of Pennsylvania at No. 6 position.
Note 1. UC Berkeley is back in the good graces of the collegiate kingmakers behind the U.S. News and World Report’s annual ranking of the nation’s top universities. The news comes not long after the publication discovered the school (along with the University of Oklahoma) had been misreporting alumni donation data since at least 2014.
Back in July, U.S. News removed Cal from the rankings after a person affiliated with the school disclosed the incorrect reporting, Forbes reported.
(Public colleges and universities typically operate under the supervision of state governments and are funded, in part, by tax dollars and subsidies from the state. As a result, these universities often offer discounted tuition to residents of their states. Public schools run the range from small liberal arts colleges to large research institutions. )
New England
Princeton and Harvard clocked in at first and second place, respectively, for best National Universities, with a three-way tie for third: Columbia, MIT, and Yale.
Boston University (BU) advanced two spots, to number 40, BU shares that spot with five peer institutions, two of them – Brandeis and Northeastern – also in Massachusetts. The other three are Case Western Reserve University, the College of William & Mary, and Tulane University.
BU moved up one notch in the magazine’s ranking of Most Innovative Schools, tying at number 27 with the University of Pennsylvania, Rice University, and UCLA. These are institutions that in the opinion of presidents, provosts, and admissions deans surveyed by U.S. News are making the most innovative improvements in terms of curriculum, faculty, students, campus life, technology, or facilities.
Pennsylvania
Some of the Pennsylvania schools that made the national university rankings: University of Pennsylvania #6, Carnegie Mellon University #25, Villanova University #46, Lehigh University #50, Pennsylvania State University – University Park #57, University of Pittsburgh #57, Drexel University #97, Temple University #104, Duquesne University #132.
New York
A total of 121 New York colleges were featured on the national list with the highest-ranking college – Columbia University — coming in at No. 3 and the lowest-ranking New York school/schools earning rankings of between 164 and 381.
Among the New York schools that were featured on the social mobility rankings were Stony Brook University — SUNY, Pace University, Vassar College, United States Military Academy, Purchase College — SUNY, Monroe College, Nyack College, Iona College, Adelphi University and the United States Merchant Marine Academy.
Washington
The University of Washington again is the highest-ranked national university on U.S. News & World Report’s 2020 best colleges list. A total of five colleges were featured on the national list with UW coming in at No. 66 nationwide, and Whitman College in Walla Walla was ranked the 46th best liberal arts college in the nation. Washington schools that made the national university rankings – University of Washington (62), Gonzaga University (79), Seattle University (139), Washington State University (166), Seattle Pacific University (192).
Texas
Rice University is once again the top Texas school in U.S. News & World Report’s newest rankings , Rice was tied at No. 17 on the 2020 list of best national universities, along with Cornell University in New York. The University of Texas at Austin was the second Texas school on the 2020 list, once again, and moved up one spot from last year. Southern Methodist University in North Texas fell five spots from last year. The University of Houston also fell 14 spots.
Looking just at public schools, UT was No. 14 nationwide, Texas A&M University was No. 27, and UH came in at No. 92. They all fell from their spots last year.
Illinois
The University of Chicago (#6) maintained its position as one of top institutions in the nation, once again earning a ranking in the top 10 of U.S. News and World Report’s “best colleges” list for 2020. The Hyde Park university tied with Stanford and the University of Pennsylvania for sixth place in the organization’s national rankings.
What has brought many of the world’s most promising students and distinguished faculty to the University of Chicag the most powerful environment for original research and new schools of thought. The demonstrated success of the College over the last decade shows that more talented students than ever share these values and aspire to join, benefit from, and contribute to the University of Chicago’s distinctive intellectual community.
Northwestern University (#9) are delighted with their steady ascent in the U.S. News survey, it is an external endorsement of their extraordinarily talented community of faculty, staff and students does every day to make Northwestern one of the leading research universities in the world.
The University of Illinois at Urbana-Champaign was the next highest-ranked Illinois school, finishing in 48th place. Loyola University (104th), the Illinois Institute of Technology (117th), DePaul University (125th) and the University of Illinois at Chicago (132nd) also finished among the rankings’ top 150.
Top Public Schools
California dominated the list. UCLA maintains its top spot with the University of California, Berkeley in second. It was the University of Michigan in Ann Arbor that rounded out the top three.
The full US News rankings
| Rank# | School | Location | Enrolment |
| 1 | Princeton University | Princeton, NJ | 5,428 |
| 2 | Harvard University | Cambridge, MA | 6,788 |
| 3 | Massachusetts Institute of Technology | Cambridge, MA | 4,602 |
| 3 | Yale University | New Haven, CT | 5,964 |
| 3 | Columbia University | New York, NY | 6,202 |
| 6 | University of Chicago | Chicago, IL | 6,552 |
| 6 | Stanford University | Stanford, CA | 7,087 |
| 6 | University of Pennsylvania | Philadelphia, PA | 10,183 |
| 9 | Northwestern University | Evanston, IL | 8,231 |
| 10 | Johns Hopkins University | Baltimore, MD | 6,064 |
| 10 | Duke University | Durham, NC | 6,682 |
| 12 | California Institute of Technology | Pasadena, CA | 948 |
| 12 | Dartmouth College | Hanover, NH | 4,417 |
| 14 | Brown University | Providence, RI | 7,043 |
| 15 | Vanderbilt University | Nashville, TN | 6,861 |
| 15 | University of Notre Dame | Notre Dame, IN | 8,617 |
| 17 | Rice University | Houston, TX | 3,992 |
| 17 | Cornell University | Ithaca, NY | 15,182 |
| 19 | Washington University in St. Louis | St. Louis, MO | 7,751 |
| 20 | University of California–Los Angeles | Los Angeles, CA | 31,577 |
| 21 | Emory University | Atlanta, GA | 7,086 |
| 22 | University of Southern California | Los Angeles, CA | 19,907 |
| 22 | University of California–Berkeley | Berkeley, CA | 30,853 |
| 24 | Georgetown University | Washington, DC | 7,459 |
| 25 | Carnegie Mellon University | Pittsburgh, PA | 6,947 |
| 25 | University of Michigan–Ann Arbor | Ann Arbor, MI | 30,318 |
| 27 | Wake Forest University | Winston-Salem, NC | 5,225 |
| 28 | University of Virginia | Charlottesville, VA | 16,777 |
| 29 | Tufts University | Medford, MA | 5,643 |
| 29 | University of Rochester | Rochester, NY | 6,535 |
| 29 | Georgia Institute of Technology | Atlanta, GA | 16,049 |
| 29 | University of North Carolina–Chapel Hill | Chapel Hill, NC | 19,117 |
| 29 | New York University | New York, NY | 26,733 |
| 34 | University of California–Santa Barbara | Santa Barbara, CA | 23,070 |
| 34 | University of Florida | Gainesville, FL | 35,491 |
| 36 | University of California–Irvine | Irvine, CA | 29,736 |
| 37 | Boston College | Chestnut Hill, MA | 9,377 |
| 37 | University of California–San Diego | La Jolla, CA | 30,285 |
| 39 | University of California–Davis | Davis, CA | 30,872 |
| 40 | Brandeis University | Waltham, MA | 3,639 |
| 40 | Case Western Reserve University | Cleveland, OH | 5,262 |
| 40 | College of William and Mary | Williamsburg, VA | 6,377 |
| 40 | Tulane University | New Orleans, LA | 6,773 |
| 40 | Northeastern University | Boston, MA | 13,909 |
| 40 | Boston University | Boston, MA | 18,515 |
| 46 | Villanova University | Villanova, PA | 6,917 |
| 46 | University of Wisconsin–Madison | Madison, WI | 32,648 |
| 48 | University of Illinois–Urbana-Champaign | Champaign, IL | 33,915 |
| 48 | University of Texas–Austin | Austin, TX | 40,804 |
| 50 | Pepperdine University | Malibu, CA | 3,627 |
| 50 | Lehigh University | Bethlehem, PA | 5,047 |
| 50 | Rensselaer Polytechnic Institute | Troy, NY | 6,628 |
| 50 | University of Georgia | Athens, GA | 29,611 |
| 54 | Santa Clara University | Santa Clara, CA | 5,520 |
| 54 | Syracuse University | Syracuse, NY | 15,226 |
| 54 | Ohio State University–Columbus | Columbus, OH | 46,820 |
| 57 | University of Miami | Coral Gables, FL | 11,117 |
| 57 | University of Pittsburgh | Pittsburgh, PA | 19,330 |
| 57 | Florida State University | Tallahassee, FL | 32,472 |
| 57 | Purdue University–West Lafayette | West Lafayette, IN | 32,672 |
| 57 | Pennsylvania State University–University Park | University Park, PA | 40,363 |
| 62 | University of Washington | Seattle, WA | 32,099 |
| 62 | Rutgers University–New Brunswick | Piscataway, NJ | 36,039 |
| 64 | Worcester Polytechnic Institute | Worcester, MA | 4,668 |
| 64 | Southern Methodist University | Dallas, TX | 6,479 |
| 64 | Loyola Marymount University | Los Angeles, CA | 6,700 |
| 64 | University of Connecticut | Storrs, CT | 19,133 |
| 64 | University of Massachusetts–Amherst | Amherst, MA | 23,515 |
| 64 | University of Maryland–College Park | College Park, MD | 30,762 |
| 70 | George Washington University | Washington, DC | 12,546 |
| 70 | Clemson University | Clemson, SC | 19,669 |
| 70 | University of Minnesota–Twin Cities | Minneapolis, MN | 34,633 |
| 70 | Texas A&M University–College Station | College Station, TX | 53,743 |
| 74 | Stevens Institute of Technology | Hoboken, NJ | 3,230 |
| 74 | Fordham University | New York, NY | 9,645 |
| 74 | Virginia Tech | Blacksburg, VA | 27,811 |
| 77 | American University | Washington, DC | 8,287 |
| 77 | Brigham Young University–Provo | Provo, UT | 31,441 |
| 79 | Binghamton University–SUNY | Binghamton, NY | 14,021 |
| 79 | Baylor University | Waco, TX | 14,188 |
| 79 | University at Buffalo–SUNY | Buffalo, NY | 21,607 |
| 79 | Indiana University–Bloomington | Bloomington, IN | 33,301 |
| 79 | Gonzaga University | Spokane, WA | |
| 84 | Colorado School of Mines | Golden, CO | 4,954 |
| 84 | Elon University | Elon, NC | 6,196 |
| 84 | Marquette University | Milwaukee, WI | 8,435 |
| 84 | University of California–Santa Cruz | Santa Cruz, CA | 17,792 |
| 84 | University of Iowa | Iowa City, IA | 23,989 |
| 84 | North Carolina State University–Raleigh | Raleigh, NC | 25,199 |
| 84 | Michigan State University | East Lansing, MI | 39,423 |
| 91 | Clark University | Worcester, MA | 2,304 |
| 91 | University of San Diego | San Diego, CA | 5,855 |
| 91 | Miami University–Oxford | Oxford, OH | 17,326 |
| 91 | Stony Brook University–SUNY | Stony Brook, NY | 17,522 |
| 91 | University of Delaware | Newark, DE | 19,117 |
| 91 | University of California–Riverside | Riverside, CA | 20,581 |
| 97 | Yeshiva University | New York, NY | 2,682 |
| 97 | University of Denver | Denver, CO | 5,801 |
| 97 | University of San Francisco | San Francisco, CA | 6,704 |
| 97 | Saint Louis University | St. Louis, MO | 7,167 |
| 97 | New Jersey Institute of Technology | Newark, NJ | 8,532 |
| 97 | Texas Christian University | Fort Worth, TX | 9,445 |
| 97 | Drexel University | Philadelphia, PA | 13,490 |
| 104 | Creighton University | Omaha, NE | 4,446 |
| 104 | Howard University | Washington, DC | 6,243 |
| 104 | University of California–Merced | Merced, CA | 7,881 |
| 104 | Loyola University Chicago | Chicago, IL | 11,919 |
| 104 | Rochester Institute of Technology | Rochester, NY | 13,513 |
| 104 | University of Oregon | Eugene, OR | 19,101 |
| 104 | University of Tennessee | Knoxville, TN | 22,815 |
| 104 | Auburn University | Auburn, AL | 24,628 |
| 104 | University of Utah | Salt Lake City, UT | 24,743 |
| 104 | University of South Carolina | Columbia, SC | 26,733 |
| 104 | Temple University | Philadelphia, PA | 29,484 |
| 104 | University of Colorado–Boulder | Boulder, CO | 30,152 |
| 104 | University of South Florida | Tampa, FL | 32,238 |
| 117 | Illinois Institute of Technology | Chicago, IL | 3,026 |
| 117 | Clarkson University | Potsdam, NY | 3,091 |
| 117 | University of Arizona | Tucson, AZ | 35,233 |
| 117 | Arizona State University–Tempe | Tempe, AZ | 42,844 |
| 121 | SUNY College of Environmental Science and Forestry | Syracuse, NY | 1,779 |
| 121 | University of Tulsa | Tulsa, OK | 3,296 |
| 121 | University of Vermont | Burlington, VT | 11,328 |
| 121 | Iowa State University | Ames, IA | 29,621 |
| 125 | University of the Pacific | Stockton, CA | 3,701 |
| 125 | Chapman University | Orange, CA | 7,281 |
| 125 | University of New Hampshire | Durham, NH | 12,782 |
| 125 | DePaul University | Chicago, IL | 14,507 |
| 125 | Simmons University | Boston, MA | |
| 130 | Drake University | Des Moines, IA | 3,015 |
| 130 | University of Kansas | Lawrence, KS | |
| 132 | University of La Verne | La Verne, CA | 2,798 |
| 132 | Duquesne University | Pittsburgh, PA | 6,013 |
| 132 | University of Dayton | Dayton, OH | 8,617 |
| 132 | Rutgers University–Newark | Newark, NJ | 9,142 |
| 132 | University of Illinois–Chicago | Chicago, IL | 20,783 |
| 132 | University of Kentucky | Lexington, KY | 22,136 |
| 132 | University of Oklahoma | Norman, OK | 22,152 |
| 139 | Seattle University | Seattle, WA | 4,764 |
| 139 | Seton Hall University | South Orange, NJ | 6,136 |
| 139 | University of Missouri | Columbia, MO | 22,503 |
| 139 | Oregon State University | Corvallis, OR | 25,699 |
| 139 | University of Cincinnati | Cincinnati, OH | 26,932 |
| 139 | The Catholic University of America | Washington, DC | |
| 139 | University of Nebraska–Lincoln | Lincoln, NE | |
| 139 | University of St. Thomas | St. Paul, MN | |
| 147 | University at Albany–SUNY | Albany, NY | 13,598 |
| 147 | University of Texas–Dallas | Richardson, TX | 19,872 |
| 147 | San Diego State University | San Diego, CA | 30,393 |
| 147 | Michigan Technological University | Houghton, MI | |
| 147 | Samford University | Birmingham, AL | |
| 147 | University of St. Joseph | West Hartford, CT | |
| 153 | Valparaiso University | Valparaiso, IN | 3,218 |
| 153 | Thomas Jefferson University | Philadelphia, PA | 3,604 |
| 153 | Mercer University | Macon, GA | 4,797 |
| 153 | University of Arkansas | Fayetteville, AR | 23,386 |
| 153 | Louisiana State University–Baton Rouge | Baton Rouge, LA | 25,361 |
| 153 | George Mason University | Fairfax, VA | 26,192 |
| 153 | University of Alabama | Tuscaloosa, AL | 33,028 |
| 153 | Quinnipiac University | Hamden, CT | |
| 153 | The New School | New York, NY | |
| 162 | Hofstra University | Hempstead, NY | 6,701 |
| 162 | Kansas State University | Manhattan, KS | 17,869 |
| 162 | University of Mississippi | University, MS | 18,007 |
| 162 | Virginia Commonwealth University | Richmond, VA | 24,058 |
| 166 | Adelphi University | Garden City, NY | 5,391 |
| 166 | Belmont University | Nashville, TN | 6,656 |
| 166 | University of Maryland–Baltimore County | Baltimore, MD | 11,260 |
| 166 | University of Alabama–Birmingham | Birmingham, AL | 13,836 |
| 166 | University of Rhode Island | Kingston, RI | 13,865 |
| 166 | Rowan University | Glassboro, NJ | 16,120 |
| 166 | Washington State University | Pullman, WA | 26,098 |
| 166 | Colorado State University | Fort Collins, CO | 26,400 |
| 166 | University of Central Florida | Orlando, FL | 58,913 |
| 166 | Montclair State University | Montclair, NJ | |
| 166 | Rutgers University–Camden | Camden, NJ | |
| 166 | St. John Fisher College | Rochester, NY | |
| 166 | University of Hawaii–Manoa | Honolulu, HI | |
| 179 | Gallaudet University | Washington, DC | 1,138 |
| 179 | University of Detroit Mercy | Detroit, MI | 2,880 |
| 179 | Missouri University of Science & Technology–Rolla | Rolla, MO | 6,848 |
| 179 | University of Idaho | Moscow, ID | 9,568 |
| 179 | St. John’s University | Queens, NY | 16,884 |
| 179 | University of Massachusetts–Lowell | Lowell, MA | |
| 185 | Biola University | La Mirada, CA | 4,010 |
| 185 | University of North Carolina–Wilmington | Wilmington, NC | 14,452 |
| 185 | Ohio University | Athens, OH | 22,275 |
| 185 | University of Houston | Houston, TX | 38,348 |
| 185 | Chatham University | Pittsburgh, PA | |
| 185 | Pacific University | Forest Grove, OR | |
| 185 | Union University | Jackson, TN | |
| 192 | Seattle Pacific University | Seattle, WA | 2,876 |
| 192 | University of Louisville | Louisville, KY | 15,642 |
| 192 | Oklahoma State University | Stillwater, OK | 20,574 |
| 192 | Ball State University | Muncie, IN | |
| 192 | Misericordia University | Dallas, PA | |
| 197 | Bellarmine University | Louisville, KY | 2,552 |
| 197 | Bethel University | St. Paul, MN | 2,857 |
| 197 | Illinois State University | Normal, IL | 18,107 |
| 197 | Towson University | Towson, MD | 19,818 |
| 197 | Loyola University New Orleans | New Orleans, LA | |
| 202 | University of St. Francis | Joliet, IL | 1,629 |
| 202 | Florida Institute of Technology | Melbourne, FL | 3,680 |
| 202 | Pace University | New York, NY | 8,960 |
| 202 | University of Maine | Orono, ME | 9,365 |
| 202 | Edgewood College | Madison, WI | |
| 202 | Maryville University of St. Louis | St Louis, MO | |
| 202 | Regis University | Denver, CO | |
| 202 | Robert Morris University | Moon Township, PA | |
| 202 | Widener University | Chester, PA | |
| 211 | Wilkes University | Wilkes-Barre, PA | 2,455 |
| 211 | University of Hartford | West Hartford, CT | 5,000 |
| 211 | Mississippi State University | Mississippi State, MS | 18,490 |
| 211 | California State University–Fresno | Fresno, CA | 22,071 |
| 211 | Kent State University | Kent, OH | 22,557 |
| 211 | Georgia State University | Atlanta, GA | 27,190 |
| 211 | Immaculata University | Immaculata, PA | |
| 218 | Lipscomb University | Nashville, TN | 2,938 |
| 218 | Hampton University | Hampton, VA | 3,672 |
| 218 | Florida International University | Miami, FL | 48,439 |
| 218 | Clarke University | Dubuque, IA | |
| 218 | Gannon University | Erie, PA | |
| 218 | Sacred Heart University | Fairfield, CT |
Methodology (adopted for 2020)
https://www.usnews.com/education/best-colleges/articles/how-us-news-calculated-the-rankings
U.S. News made some changes for its 35th edition of the rankings. The publication updated its methodology to give the nearly 1,400 schools it evaluated more credit based on how they supported first-generation college students through graduation.
This year, the publication also created a new ranking category, Top Performers on Social Mobility, evaluating schools that best serve underrepresented students by looking at enrollment and graduation rates of low-income students
The publication evaluates schools based on the following.
Student outcomes (including the new Social mobility factor), Student excellence, Faculty resources, Expert opinion, Financial resources, Alumni giving.
The Ranking Factors
High school counselor opinion was discontinued as part of expert opinion. Otherwise, there were no changes in weights assigned to each factor for the 2020 edition. There are, however, small differences in how some of the factors were calculated, described below. For a more detailed look at how the rankings are computed on a factor-by-factor level, please see Ranking Criteria and Weights and Morse Code: Inside the College Rankings.
Factors and weights used in the U.S. News Best Colleges rankings.
Outcomes (35%)
More than one-third of a school’s rank comes from its success at retaining and graduating students within 150% of normal time (six years). It receives the highest weight in our rankings because degree completion is necessary to receive the full benefits of undergraduate study from employers and graduate schools. We approach outcomes from angles of graduation and retention (22%), graduation rate performance (8%) and social mobility (5%).
Graduation and retention rates: This has two components.
A four-year rolling average of the proportion of each entering class (fall 2009-fall 2012) earning a degree in six years or less (17.6%).
A four-year rolling average of the proportion of first-year entering students (fall 2014-fall 2017) who returned the following fall (4.4%).
Graduation rate performance: We compared each college’s actual six-year graduation rate with what we predicted for its fall 2012 entering class. The predicted rates were modeled from admissions data, proportion of undergraduates awarded Pell Grants, school financial resources, proportion of federal financial aid recipients who are first generation, and National Universities’ math and science, or STEM, orientations.
The first-generation students variable was new for the 2020 rankings and in effect gives schools more credit for their graduation rates when accomplished with higher proportions of students who were the first in their immediate families to attend college. The data was sourced from the U.S. Department of Education’s College Scorecard. Its inclusion improved the model’s predictive power.
Social mobility: Measures how well schools graduated students who received federal Pell Grants (those typically coming from households whose family incomes are less than $50,000 annually, though most Pell Grant money goes to students with a total family income below $20,000). New for the 2020 edition, data sourced from the federal government was used for nonresponders. Also, the below factors (weighted 2.5% each) were computed using two-year averages of fall 2011 and fall 2012 entering cohorts.
Pell Grant graduation rates are the six-year graduation rates of Pell Grant students adjusted to give much more credit to schools with larger Pell student proportions.
Pell Grant graduation rate performance is the factor that compares each school’s six-year graduation rate among Pell recipients with its six-year graduation rate among non-Pell recipients by dividing the former into the latter, then adjusting to give much more credit to schools with larger Pell student proportions. The higher a school’s Pell graduation rate relative to its non-Pell graduation rate up to the rates being equal, the better it scores.
U.S. News published a distinct social mobility ranking for all schools. The social mobility ranking is computed from the two ranking factors assessing graduation rates of Pell-awarded students (5% of the rankings total).
Additionally, for benchmarking purposes each schools’ ranking factors sections on its directory page includes both its social mobility rank and a distinct outcomes rank. Although the ranks themselves are not used to determine schools’ overall rankings, they are displayed to enable prospective students, parents and institutions to make comparisons on related ranking factors. The outcomes rank also includes the two social mobility ranking factors but also average graduation rates, first-year retention rates and graduation rate performance that in total comprise 35% of a school’s overall score.
We also changed how the graduation and retention rate benchmark ranking was calculated. It is once again computed from a school’s total score in these two ranking indicators: average six-year graduation rate and average first-year retention rate. In the 2019 edition only, it was based on a school’s score in these four ranking factors: average six-year graduation rate, average first-year retention rate, Pell Grant graduation rate and Pell Grant graduation rate performance.
Faculty Resources (20%)
Research shows the greater access students have to quality instructors, the more engaged they will be in class and the more they will learn and likely graduate. U.S. News uses five factors from the 2018-2019 academic year to assess a school’s commitment to instruction: class size, faculty salary, faculty with the highest degree in their fields, student-faculty ratio and proportion of faculty who are full time.
Class size is the most highly weighted faculty resource measure, at 8%. Schools score better the greater their proportions of smaller classes for fall 2018.
Faculty salary is weighted at 7% and is the average faculty pay plus benefits during the 2017-2018 and 2018-2019 academic years, adjusted for regional differences in the cost of living. Nonresponders to the faculty salary question for the first time had modified federal government faculty salary data used as the basis for their estimates. Also new for the 2020 rankings, the faculty salary figures were adjusted using open source data from the Bureau of Economic Analysis regional price parities 2017 dataset published in May 2019. These regional price indexes allow comparisons from one metro area to another and measure the differences in price levels across states and metropolitan areas for a given year. They are expressed as a percentage of the overall national price level. The regional price indexes cover all consumption goods and services, including housing rents.
U.S. News also factors the proportion of full-time faculty with the highest degree in their fields (3%), student-faculty ratio (1%) and the proportion of faculty who are full time (1%).
Expert Opinion (20%)
Academic reputation matters because it factors things that cannot easily be captured elsewhere. For example, an institution known for having innovative approaches to teaching may perform especially well on this indicator, whereas a school struggling to keep its accreditation will likely perform poorly.
We take a two-year weighted average of ratings from top academics – presidents, provosts and deans of admissions – who rate the academic quality of peer institutions with which they are familiar on a scale of 1 (marginal) to 5 (distinguished).
U.S. News collected the data by administering peer assessment surveys in spring 2018 and 2019 directly to schools. Of the 4,815 academics who were sent questionnaires, 43% responded. This response rate is well up from 36% the previous year.
The high school counselor opinion survey was not administered and its ranking factor was dropped from the National Universities and National Liberal Arts Colleges rankings formulas altogether because U.S. News had greater confidence in its peer assessment data. High school counselor ratings had never been included as a ranking factor in the Regional Universities and Regional Colleges methodology. The high school counselor assessment’s 5 percentage point weight in the ranking was added to the peer assessment weight for the National Universities and National Liberal Arts Colleges rankings formulas, increasing the weight of that indicator in those two categories from 15% to 20% – equal to what is done for Regional Universities and Regional Colleges.
Financial Resources (10%)
Generous per-student spending indicates that a college can offer a wide variety of programs and services. U.S. News measures financial resources by using the average spending per student on instruction, research, student services and related educational expenditures in the 2017 and 2018 fiscal years. Spending on sports, dorms and hospitals does not count.
A small adjustment for the 2020 rankings: For improved cohort alignment, we adjusted the denominator cohorts a year back so that fiscal year 2018 spending was compared with 2017 enrollment and fiscal year 2017 spending was compared with 2016 enrollment.
For non-responders, data sourced from the federal government was used – a change from the previous rankings edition.
Student Excellence (10%)
A school’s academic atmosphere is influenced by the selectivity of its admissions. Simply put, students who achieved strong grades and test scores during high school have the highest probability of succeeding at challenging college-level coursework; enabling instructors to design classes that have great rigor.
Standardized tests: U.S. News factors admissions test scores for all enrollees who took the mathematics and evidence-based reading and writing portions of the SAT and the composite ACT. We weighted standardized tests at 7.75%.
Schools sometimes fail to report SAT and ACT scores for students in these categories: athletes, international students, minority students, legacies, those admitted by special arrangement and those who started in summer 2018. For any school that did not report all scores or that declined to say whether all scores were reported, U.S. News reduced its combined SAT/ACT percentile distribution value used in the ranking model by 15%. If the combined percentage of the fall 2018 entering class submitting test scores is less than 75% of all new entrants, its combined SAT/ACT percentile distribution value used in the rankings was discounted by 15%.
High school class standing: U.S. News incorporates the proportion of enrolled first-year students at National Universities and National Liberal Arts Colleges who graduated in the top 10% of their high school classes. It contributes 2.25% toward schools’ overall scores.
For Regional Universities and Regional Colleges, we used the proportion of those who graduated in the top quarter of their high school classes. New for this ranking is that high school class standing data from high schools that reported on fewer than 10% of their fall 2018 new entrants received an estimate instead of having their scores discounted. Also new is that colleges that reported high school class standing data on less than 20% of new entrants have their fall 2018 data footnoted. This is a decrease from 50% of new entrants in previous editions.
Alumni Giving (5%)
This is the average percentage of living alumni with bachelor’s degrees who gave to their school during 2016-2017 and 2017-2018. Giving measures student satisfaction and post-graduate engagement. This year, U.S. News only incorporated data it collected from its own data collection.
————————————————————————-
< Previous year >
2019 U.S. News & World Report – Summary
Routinely, Stanford, Harvard, Yale and Princeton are among the top American universities, though their order often changes depending on the year and the specific methodology used. Also mainstays in the top grouping are usually Columbia, MIT and University of Chicago.
California is home to numerous high-quality colleges and universities. For the second year in a row, colleges located in California snagged more than 10 percent of the top 100 spots. Also a repeat: Stanford came in number one in the Golden State and seven of the state’s top 12 schools were part of the UC system.
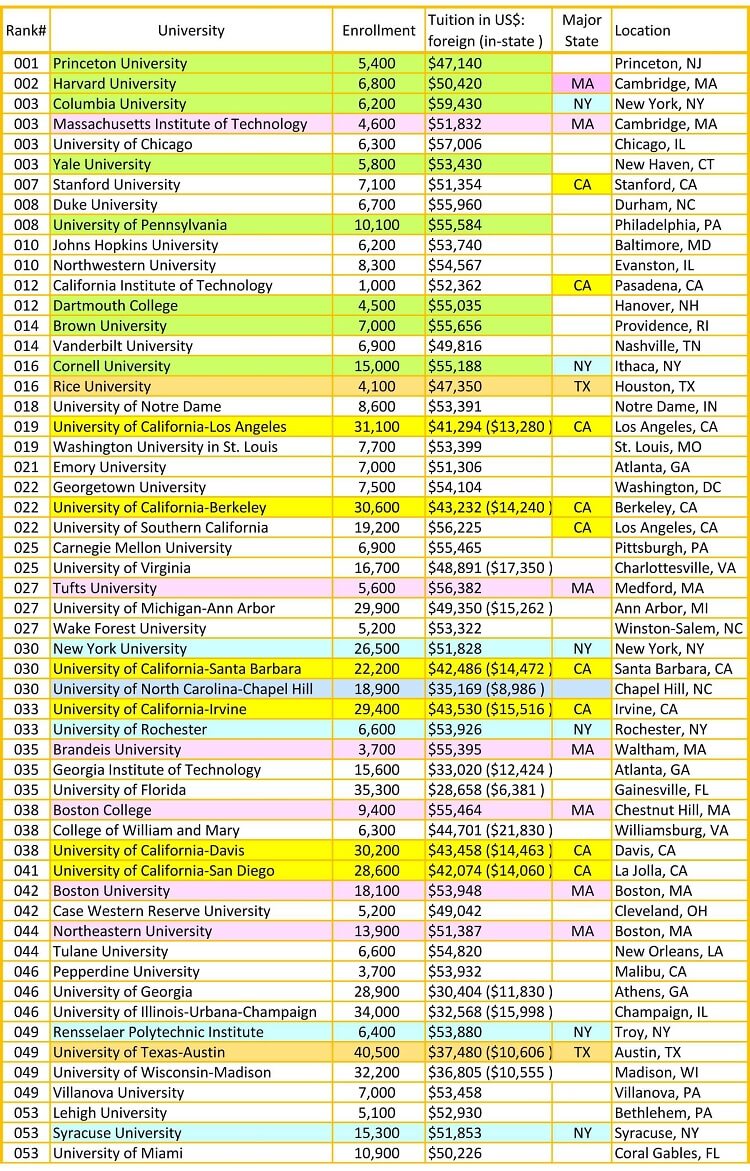
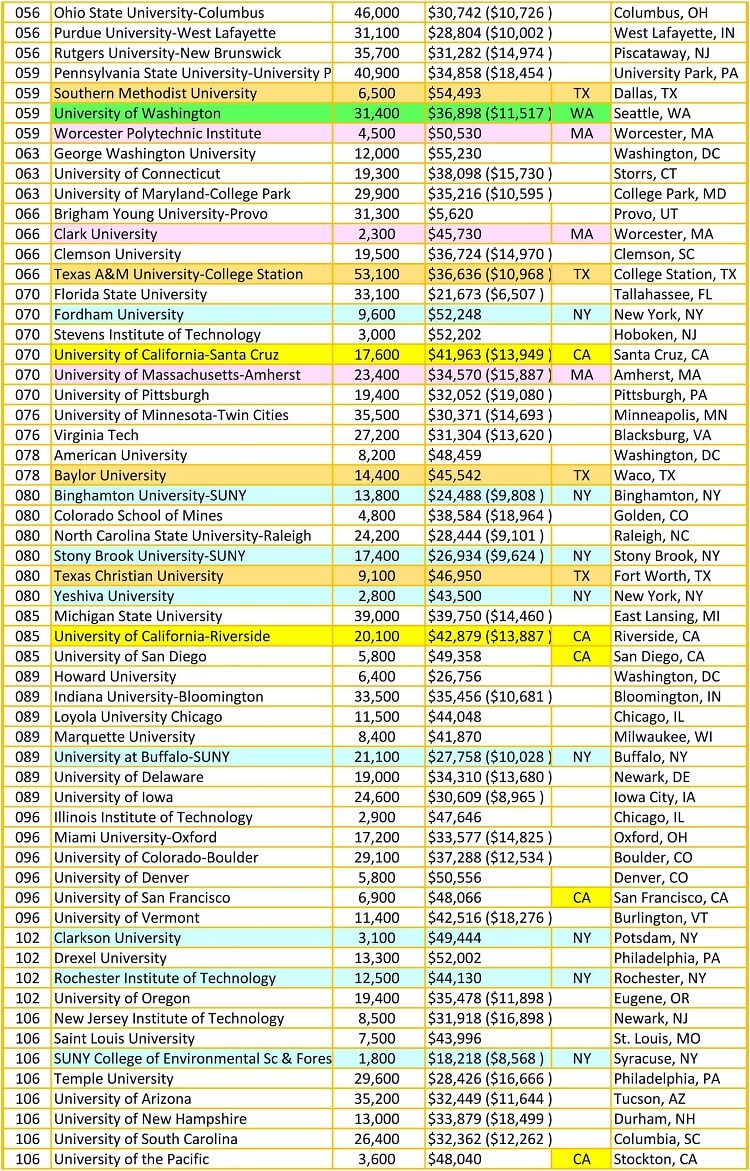
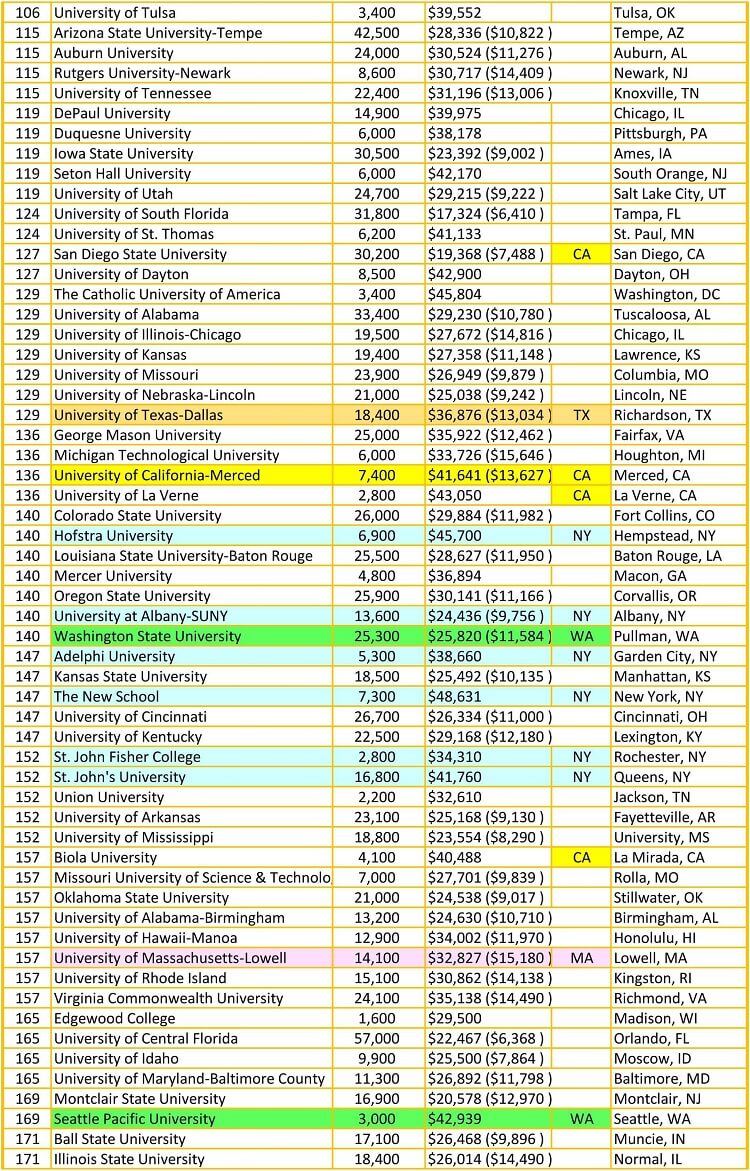
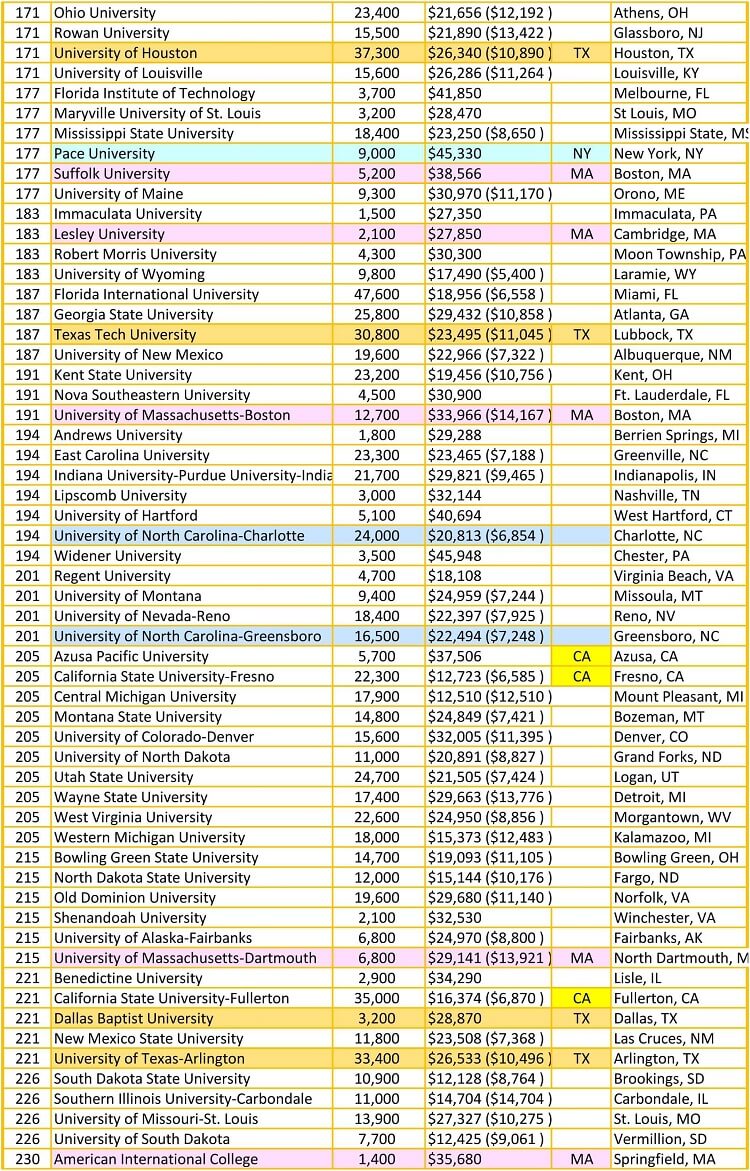
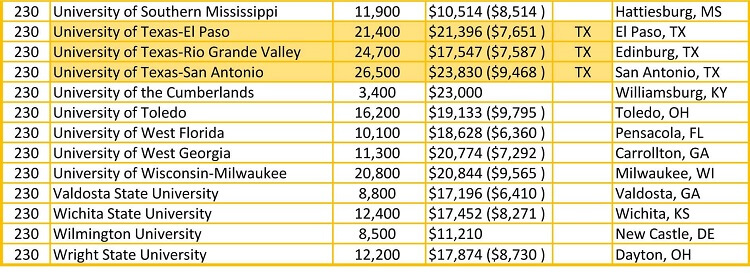
Bruins and Trojans have something new to argue about: The magazine ranks the USC as the No. 23 national university and the UCLA at 24, tied with the University of Virginia.
UC Irvine is ranked 39th, UC San Diego is ranked 44th, Pepperdine University is tied at 50 with Penn State, UC Riverside is No. 118, San Diego State is No. 146, the University of La Verne is ranked 152, Azusa Pacific University is No. 183 and Cal State Fullerton is ranked 202.
The Philadelphia area’s abundance of higher-education institutions providing a strong showing. University of Pennsylvania rose one spot to tie with Duke University for 8th in the National University category.
Ranked 53rd, the University of Texas at Austin is a premier educational institution. More than 51,000 students and 3,000 faculty call this school home. Its undergraduate engineering and business programs are equally lauded, ranking 8th and 10th respectively. The flagship school of the sprawling University of Texas System offers undergraduate degrees in over 170 fields of interest. The honors programs is offered in business, engineering, liberal arts and natural sciences studies.
Source of Information资料来源:
US News & World Report – http://colleges.usnews.rankingsandreviews.com/best-colleges/rankings/national-universities