今年QS包括 1,500 家機構。 2024 年 QS 世界大學排名引入了三個新指標,以反映學生不斷變化的優先事項以及當今高等教育機構不斷變化的使命:對可持續發展的承諾; 更加重視支持畢業生就業能力並加強國際研究合作,以解決世界上最大的挑戰。 *QS 是第一個將 substainability / 可持續性作為核心指標的主要世界排名。
< 前 1,200 名大學可在本頁底部找到 >
~ 我們的 精英計劃 (Elite Program)可助同學們進入這些世界名校,請即聯絡本中心 。免費查詢: Tel 2391-9713, WhatsApp 5531-1001 。~
Source: https://www.qs.com/rankings-released-qs-world-university-rankings-2024/
Top Universities by country/city
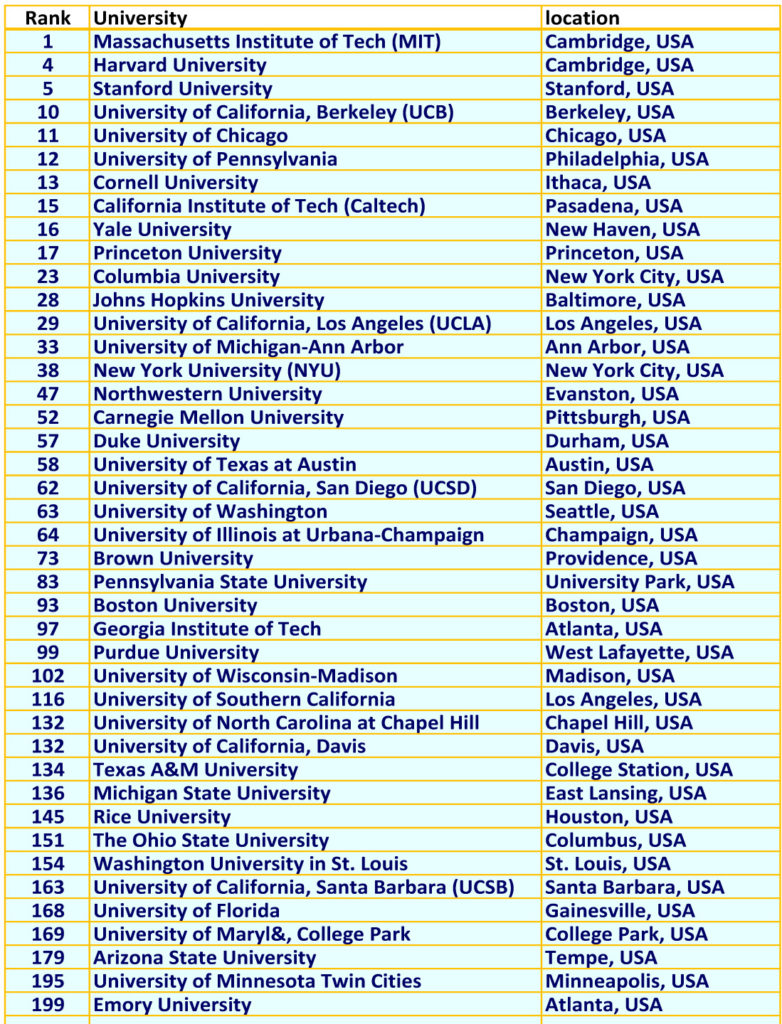
*QS 2024 Top Universities in USA:
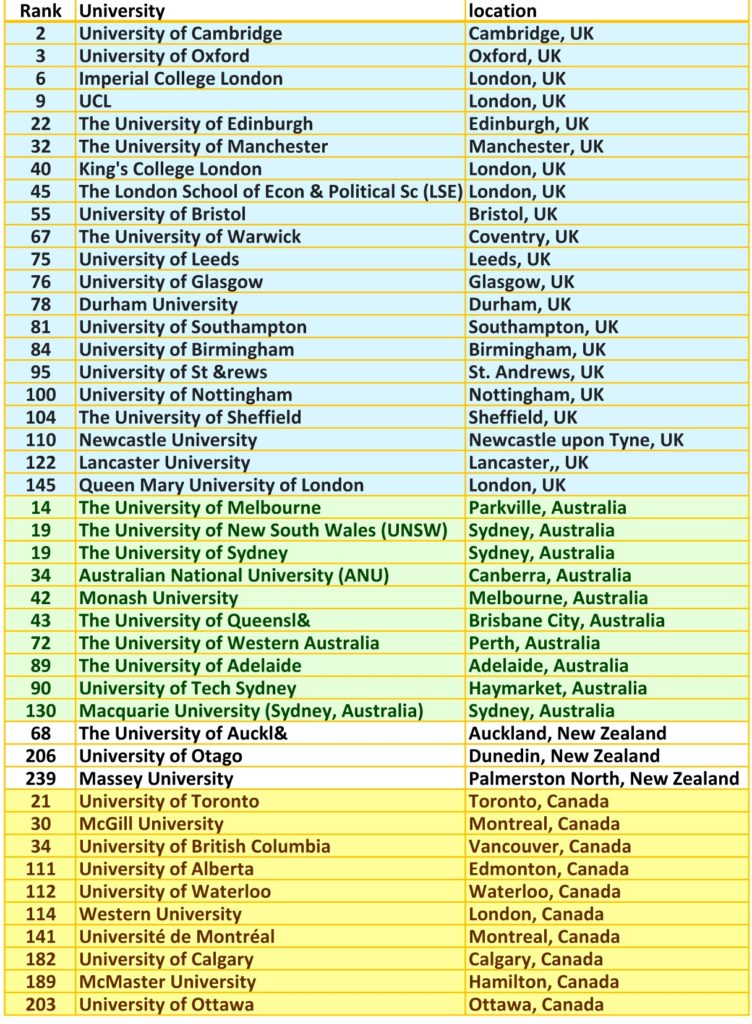
*QS 2024 Top Universities in UK, Canada and Australia:
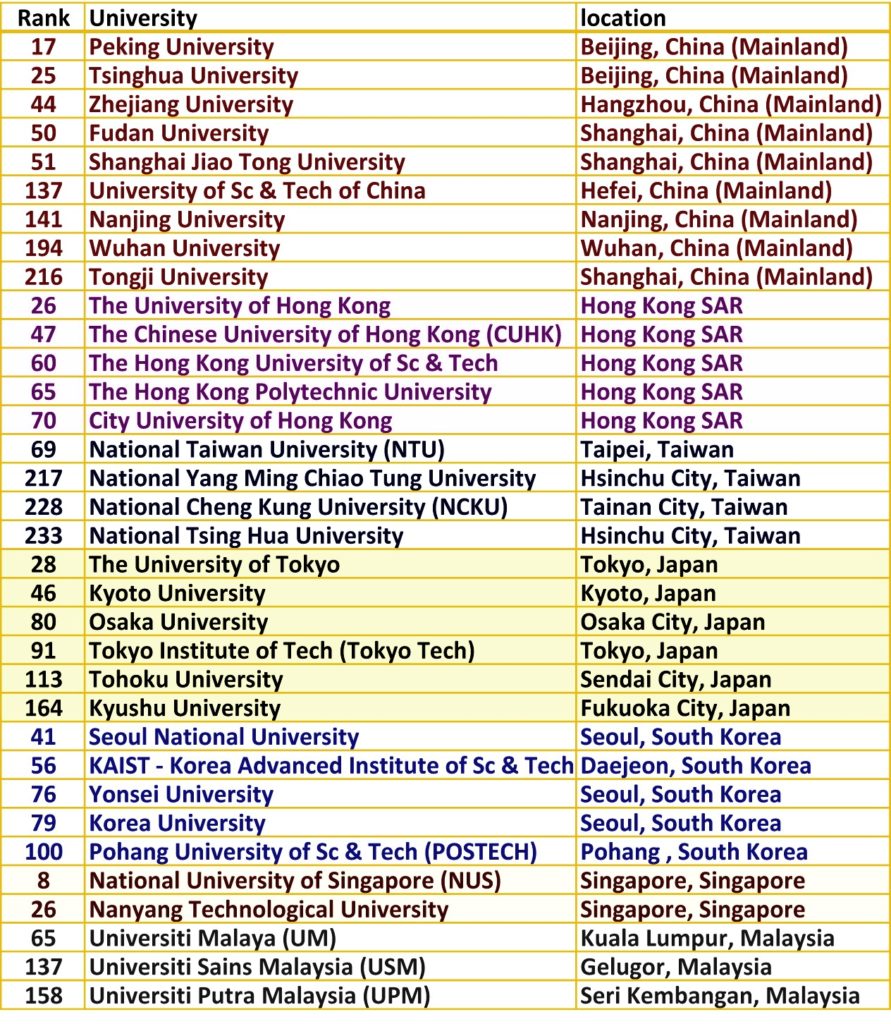
*QS 2024 Top Universities in Asia
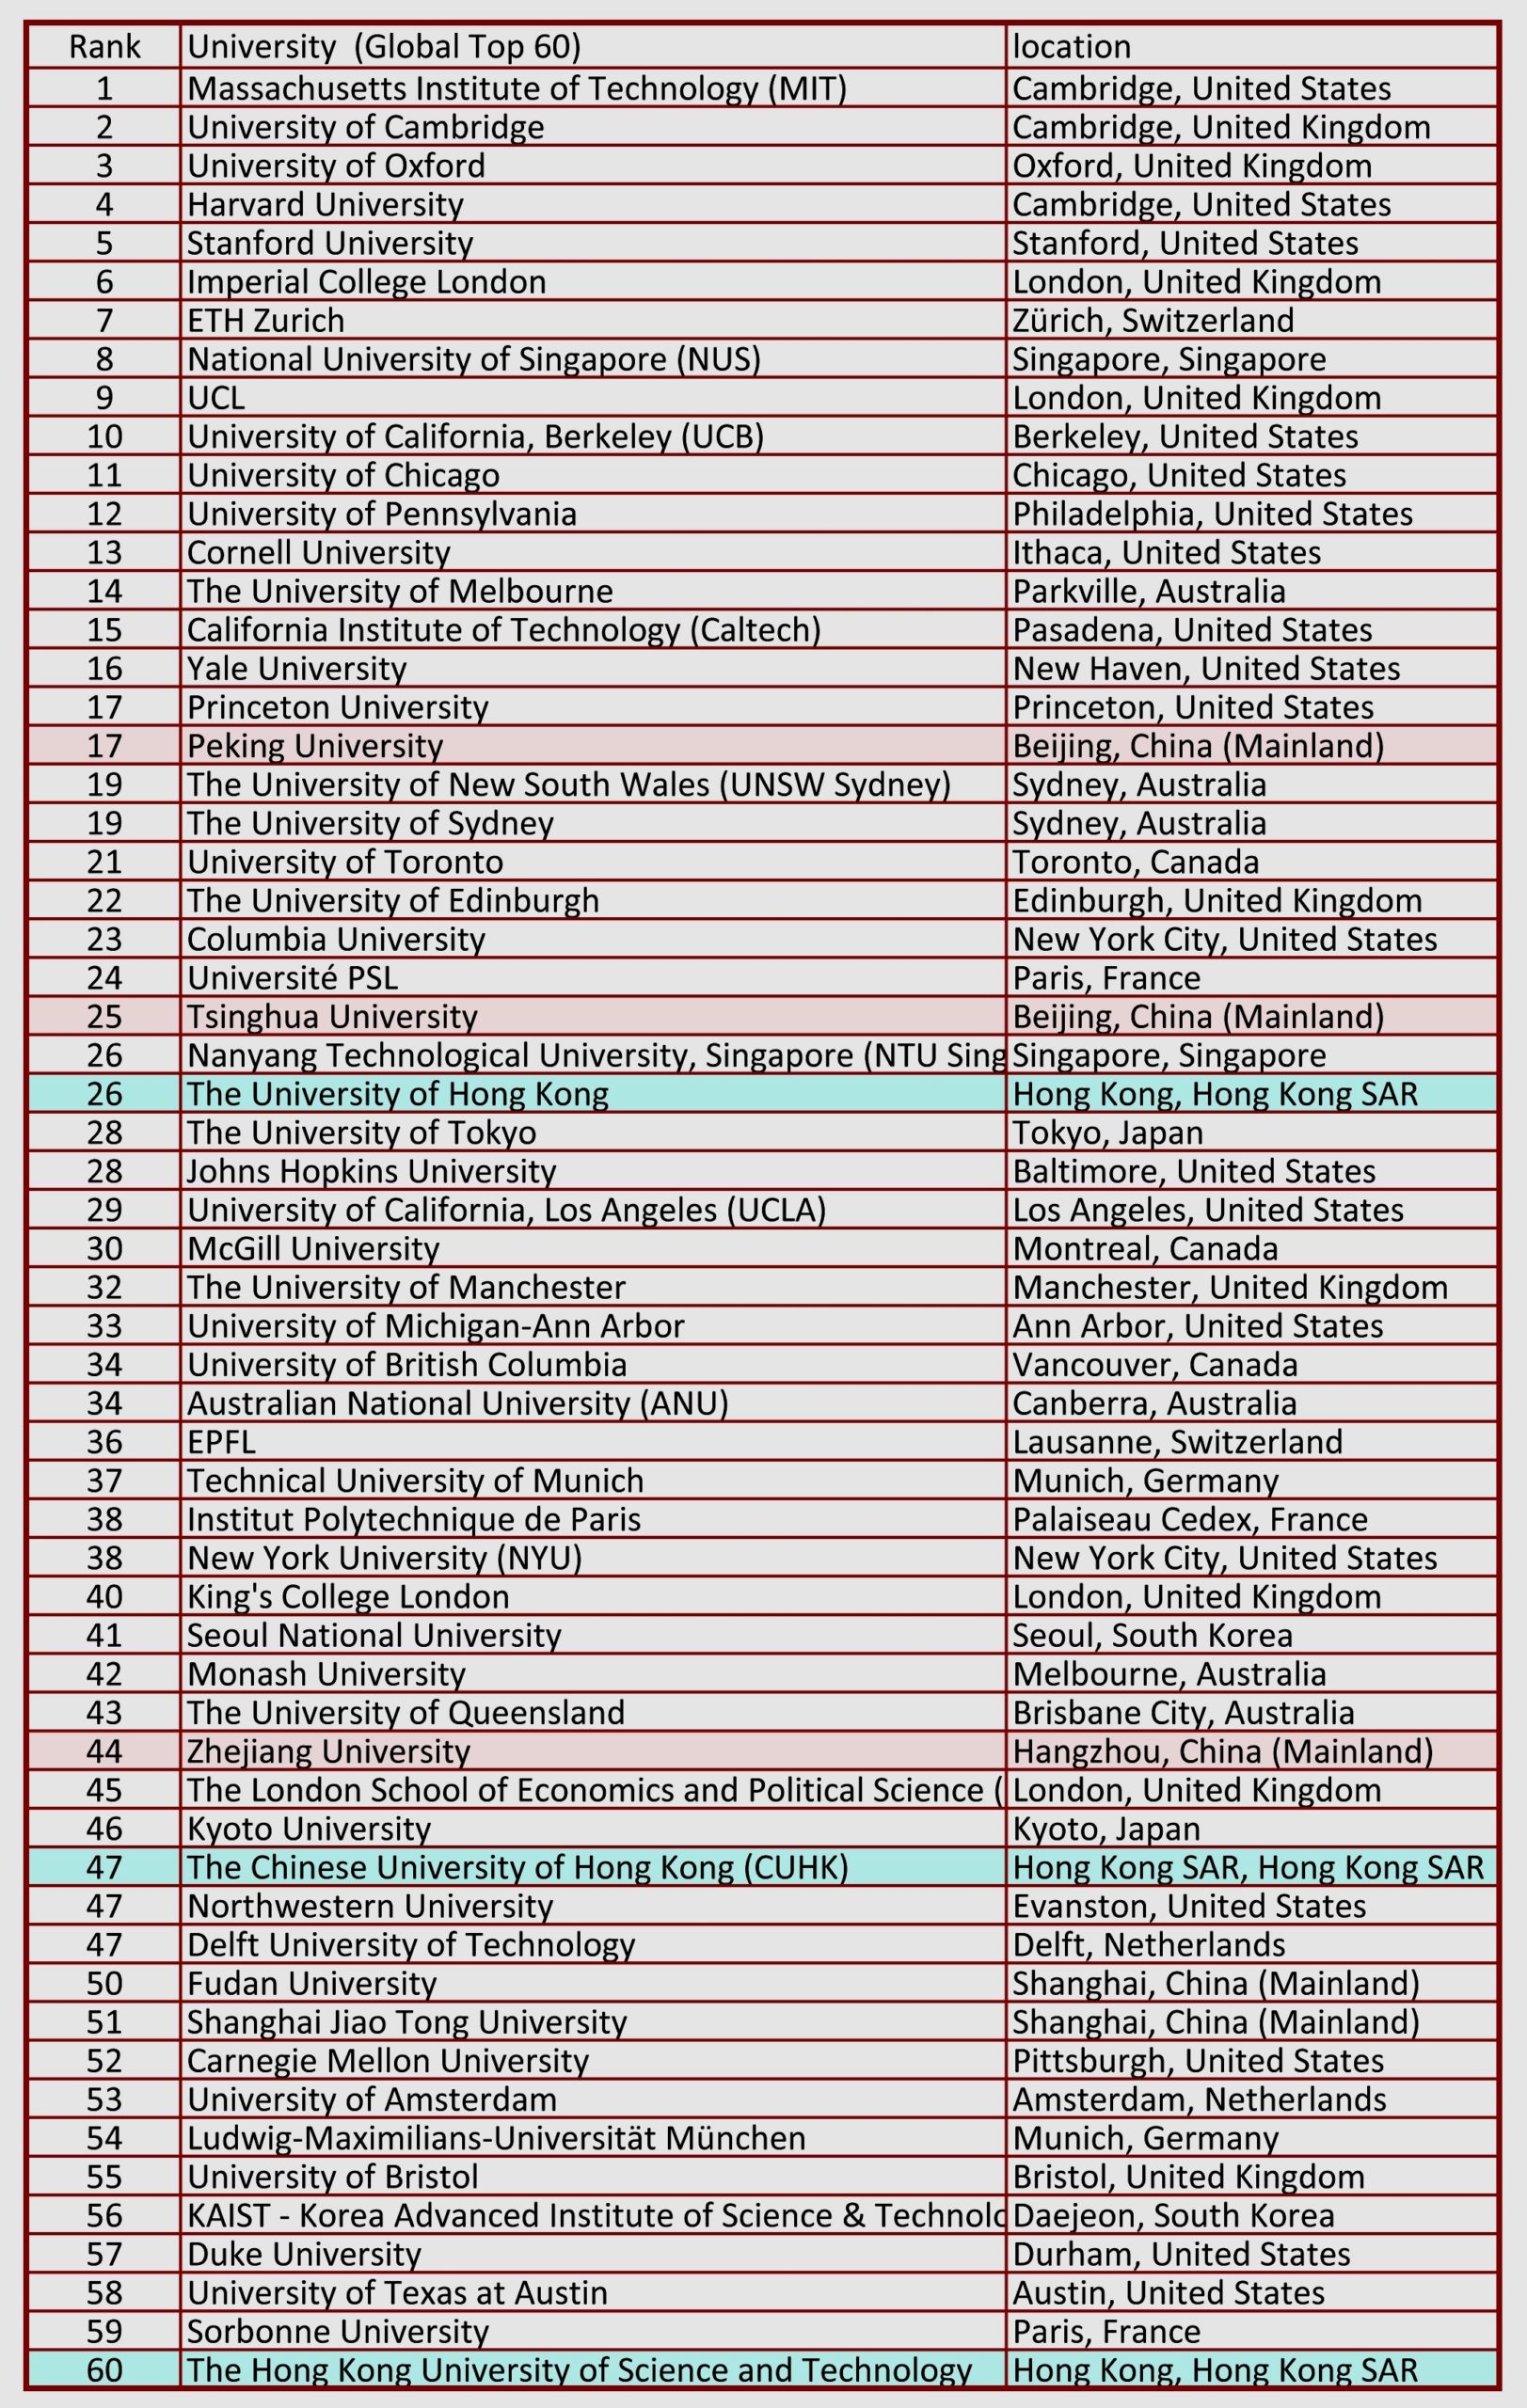
前 1200 名 Top 1,200
| Rank | University | Location |
| 1 | Massachusetts Institute of Technology (MIT) | Cambridge, United States |
| 2 | University of Cambridge | Cambridge, United Kingdom |
| 3 | University of Oxford | Oxford, United Kingdom |
| 4 | Harvard University | Cambridge, United States |
| 5 | Stanford University | Stanford, United States |
| 6 | Imperial College London | London, United Kingdom |
| 7 | ETH Zurich | Zürich, Switzerland |
| 8 | National University of Singapore (NUS) | Singapore, Singapore |
| 9 | UCL | London, United Kingdom |
| 10 | University of California, Berkeley (UCB) | Berkeley, United States |
| 11 | University of Chicago | Chicago, United States |
| 12 | University of Pennsylvania | Philadelphia, United States |
| 13 | Cornell University | Ithaca, United States |
| 14 | The University of Melbourne | Parkville, Australia |
| 15 | California Institute of Technology (Caltech) | Pasadena, United States |
| 16 | Yale University | New Haven, United States |
| 17 | Princeton University | Princeton, United States |
| 17 | Peking University | Beijing, China (Mainland) |
| 19 | The University of New South Wales (UNSW Sydney) | Sydney, Australia |
| 19 | The University of Sydney | Sydney, Australia |
| 21 | University of Toronto | Toronto, Canada |
| 22 | The University of Edinburgh | Edinburgh, United Kingdom |
| 23 | Columbia University | New York City, United States |
| 24 | Université PSL | Paris, France |
| 25 | Tsinghua University | Beijing, China (Mainland) |
| 26 | Nanyang Technological University, Singapore (NTU Singapore) | Singapore, Singapore |
| 26 | The University of Hong Kong | Hong Kong, Hong Kong SAR |
| 28 | The University of Tokyo | Tokyo, Japan |
| 29 | University of California, Los Angeles (UCLA) | Los Angeles, United States |
| 30 | McGill University | Montreal, Canada |
| 32 | The University of Manchester | Manchester, United Kingdom |
| 33 | University of Michigan-Ann Arbor | Ann Arbor, United States |
| 34 | University of British Columbia | Vancouver, Canada |
| 34 | Australian National University (ANU) | Canberra, Australia |
| 36 | EPFL | Lausanne, Switzerland |
| 37 | Technical University of Munich | Munich, Germany |
| 38 | Institut Polytechnique de Paris | Palaiseau Cedex, France |
| 38 | New York University (NYU) | New York City, United States |
| 40 | King’s College London | London, United Kingdom |
| 41 | Seoul National University | Seoul, South Korea |
| 42 | Monash University | Melbourne, Australia |
| 43 | The University of Queensland | Brisbane City, Australia |
| 44 | Zhejiang University | Hangzhou, China (Mainland) |
| 46 | Kyoto University | Kyoto, Japan |
| 47 | The Chinese University of Hong Kong (CUHK) | Hong Kong, Hong Kong SAR |
| 47 | Northwestern University | Evanston, United States |
| 47 | Delft University of Technology | Delft, Netherlands |
| 50 | Fudan University | Shanghai, China (Mainland) |
| 51 | Shanghai Jiao Tong University | Shanghai, China (Mainland) |
| 52 | Carnegie Mellon University | Pittsburgh, United States |
| 53 | University of Amsterdam | Amsterdam, Netherlands |
| 54 | Ludwig-Maximilians-Universität München | Munich, Germany |
| 55 | University of Bristol | Bristol, United Kingdom |
| 56 | KAIST – Korea Advanced Institute of Science & Technology | Daejeon, South Korea |
| 57 | Duke University | Durham, United States |
| 58 | University of Texas at Austin | Austin, United States |
| 59 | Sorbonne University | Paris, France |
| 60 | The Hong Kong University of Science and Technology | Hong Kong, Hong Kong SAR |
| 61 | KU Leuven | Leuven, Belgium |
| 62 | University of California, San Diego (UCSD) | San Diego, United States |
| 63 | University of Washington | Seattle, United States |
| 64 | University of Illinois at Urbana-Champaign | Champaign, United States |
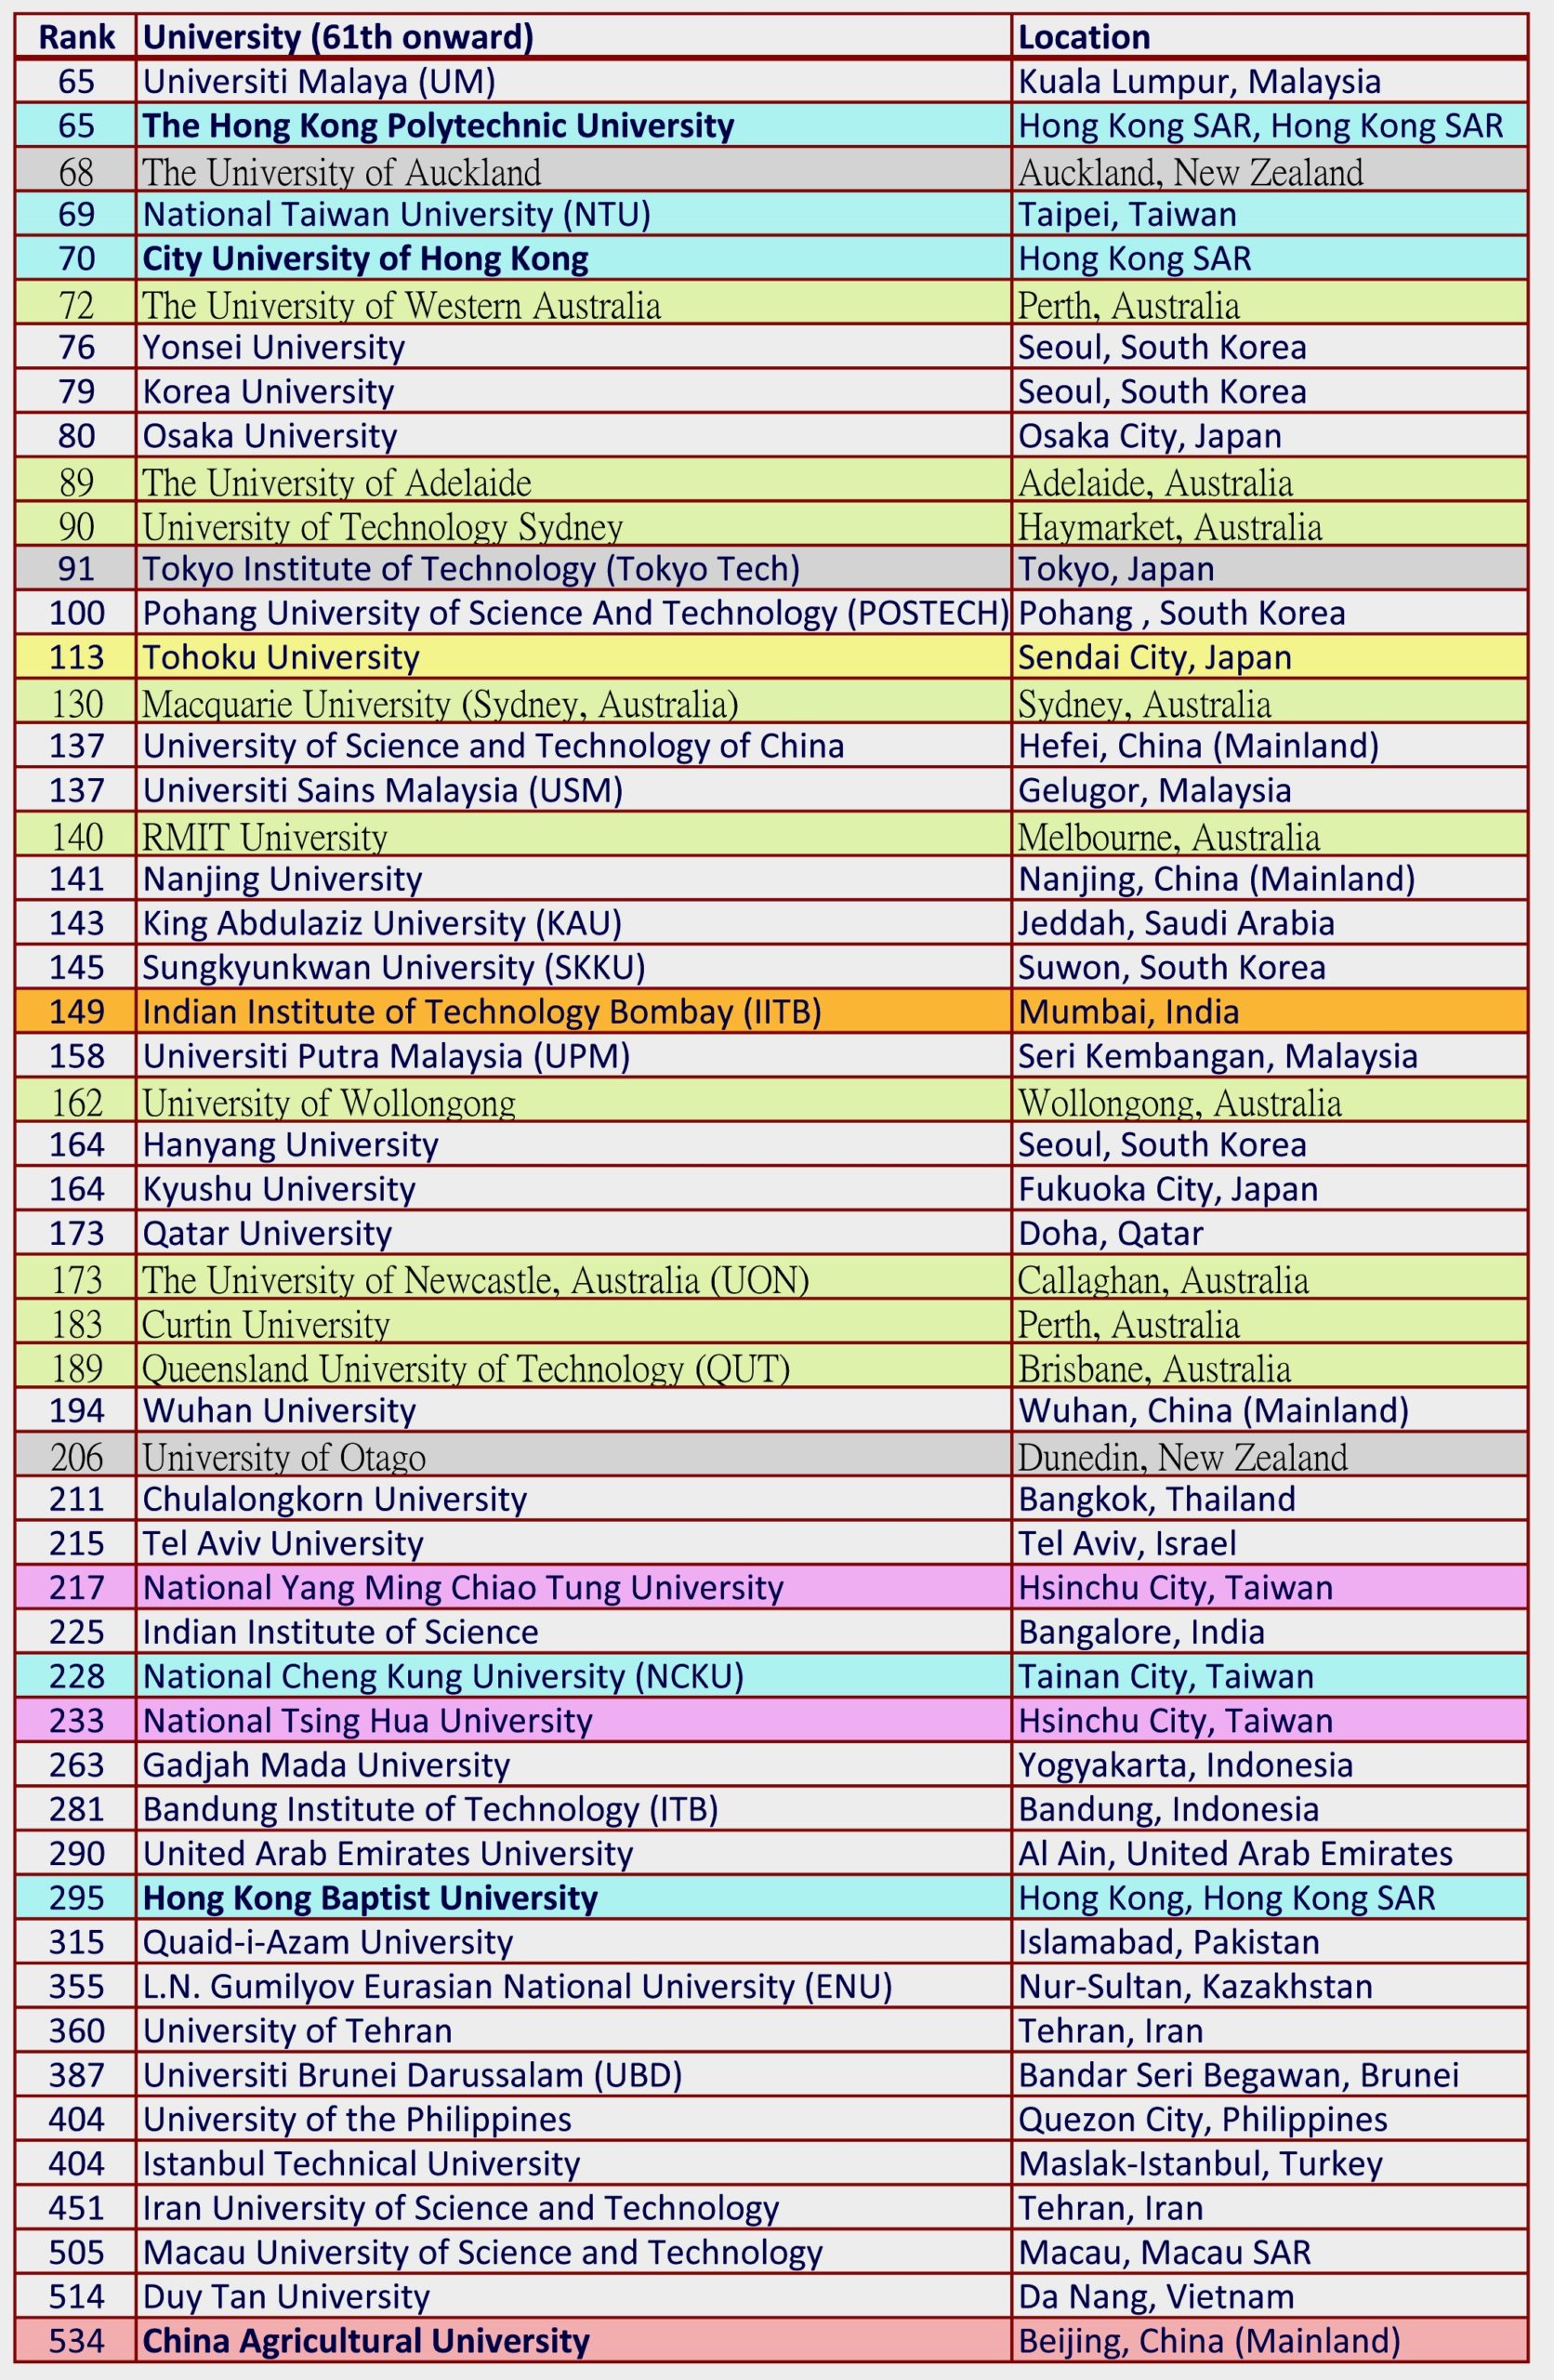
| 65 | Universiti Malaya (UM) | Kuala Lumpur, Malaysia |
| 65 | The Hong Kong Polytechnic University | Hong Kong SAR, Hong Kong SAR |
| 67 | The University of Warwick | Coventry, United Kingdom |
| 68 | The University of Auckland | Auckland, New Zealand |
| 69 | National Taiwan University (NTU) | Taipei, Taiwan |
| 71 | Université Paris-Saclay | Gif-sur-Yvette,, France |
| 72 | The University of Western Australia | Perth, Australia |
| 73 | KTH Royal Institute of Technology | Stockholm, Sweden |
| 73 | Brown University | Providence, United States |
| 75 | University of Leeds | Leeds, United Kingdom |
| 76 | Yonsei University | Seoul, South Korea |
| 76 | University of Glasgow | Glasgow, United Kingdom |
| 78 | Durham University | Durham, United Kingdom |
| 79 | Korea University | Seoul, South Korea |
| 80 | Osaka University | Osaka City, Japan |
| 81 | University of Southampton | Southampton, United Kingdom |
| 81 | Trinity College Dublin, The University of Dublin | Dublin, Ireland |
| 83 | Pennsylvania State University | University Park, United States |
| 84 | University of Birmingham | Birmingham, United Kingdom |
| 85 | Universidade de São Paulo | São Paulo, Brazil |
| 85 | Lund University | Lund, Sweden |
| 87 | Lomonosov Moscow State University | Moscow, Russia |
| 87 | Universität Heidelberg | Heidelberg, Germany |
| 89 | The University of Adelaide | Adelaide, Australia |
| 90 | University of Technology Sydney | Haymarket, Australia |
| 91 | University of Zurich | Zürich, Switzerland |
| 91 | Tokyo Institute of Technology (Tokyo Tech) | Tokyo, Japan |
| 93 | Universidad Nacional Autónoma de México (UNAM) | Mexico City, Mexico |
| 93 | Boston University | Boston, United States |
| 95 | University of St Andrews | St. Andrews, United Kingdom |
| 95 | Universidad de Buenos Aires (UBA) | Buenos Aires, Argentina |
| 97 | Georgia Institute of Technology | Atlanta, United States |
| 98 | Freie Universitaet Berlin | Berlin, Germany |
| 99 | Purdue University | West Lafayette, United States |
| 100 | Pohang University of Science And Technology (POSTECH) | Pohang , South Korea |
| 100 | University of Nottingham | Nottingham, United Kingdom |
| 102 | University of Wisconsin-Madison | Madison, United States |
| 103 | Pontificia Universidad Católica de Chile (UC) | Santiago, Chile |
| 104 | The University of Sheffield | Sheffield, United Kingdom |
| 105 | Uppsala University | Uppsala, Sweden |
| 106 | RWTH Aachen University | Aachen, Germany |
| 107 | Utrecht University | Utrecht, Netherlands |
| 107 | University of Copenhagen | Copenhagen, Denmark |
| 109 | Aalto University | Espoo, Finland |
| 110 | Newcastle University | Newcastle upon Tyne, United Kingdom |
| 111 | University of Alberta | Edmonton, Canada |
| 112 | University of Waterloo | Waterloo, Canada |
| 113 | Tohoku University | Sendai City, Japan |
| 114 | Western University | London, Canada |
| 115 | University of Helsinki | Helsinki, Finland |
| 116 | University of Southern California | Los Angeles, United States |
| 117 | University of Oslo | Oslo, Norway |
| 118 | Stockholm University | Stockholm, Sweden |
| 119 | KIT, Karlsruhe Institute of Technology | Karlsruhe, Germany |
| 120 | Humboldt-Universität zu Berlin | Berlin, Germany |
| 121 | Technical University of Denmark | Kongens Lyngby, Denmark |
| 122 | Lancaster University | Lancaster,, United Kingdom |
| 123 | Politecnico di Milano | Milan, Italy |
| 124 | Eindhoven University of Technology | Eindhoven, Netherlands |
| 124 | University of Basel | Basel, Switzerland |
| 126 | Leiden University | Leiden, Netherlands |
| 126 | University of Bern | Bern, Switzerland |
| 128 | University of Geneva | Geneva, Switzerland |
| 129 | Chalmers University of Technology | Gothenburg, Sweden |
| 130 | University of Vienna | Vienna, Austria |
| 130 | Macquarie University (Sydney, Australia) | Sydney, Australia |
| 132 | University of North Carolina at Chapel Hill | Chapel Hill, United States |
| 134 | Sapienza University of Rome | Rome, Italy |
| 134 | Texas A&M University | College Station, United States |
| 136 | Michigan State University | East Lansing, United States |
| 137 | University of Science and Technology of China | Hefei, China (Mainland) |
| 137 | Universiti Sains Malaysia (USM) | Gelugor, Malaysia |
| 139 | University of Groningen | Groningen, Netherlands |
| 140 | RMIT University | Melbourne, Australia |
| 141 | Nanjing University | Nanjing, China (Mainland) |
| 141 | Université de Montréal | Montreal, Canada |
| 143 | King Abdulaziz University (KAU) | Jeddah, Saudi Arabia |
| 143 | Aarhus University | Aarhus, Denmark |
| 145 | Sungkyunkwan University (SKKU) | Suwon, South Korea |
| 145 | Queen Mary University of London | London, United Kingdom |
| 145 | Rice University | Houston, United States |
| 148 | University of Bath | Bath, United Kingdom |
| 149 | Indian Institute of Technology Bombay (IITB) | Mumbai, India |
| 149 | Universitat Autònoma de Barcelona | Barcelona, Spain |
| 151 | Wageningen University & Research | Wageningen, Netherlands |
| 151 | The Ohio State University | Columbus, United States |
| 153 | University of Exeter | Exeter, United Kingdom |
| 154 | Washington University in St. Louis | St. Louis, United States |
| 154 | Cardiff University | Cardiff, United Kingdom |
| 154 | Alma Mater Studiorum – University of Bologna | Bologna, Italy |
| 154 | Technische Universität Berlin (TU Berlin) | Berlin, Germany |
| 158 | Universiti Putra Malaysia (UPM) | Seri Kembangan, Malaysia |
| 159 | Universidad de Chile | Santiago, Chile |
| 159 | Ghent University | Ghent, Belgium |
| 159 | Universiti Kebangsaan Malaysia (UKM) | Bangi, Malaysia |
| 162 | University of Wollongong | Wollongong, Australia |
| 163 | University of California, Santa Barbara (UCSB) | Santa Barbara, United States |
| 164 | Hanyang University | Seoul, South Korea |
| 164 | Kyushu University | Fukuoka City, Japan |
| 164 | Universitat de Barcelona | Barcelona, Spain |
| 167 | University of York | York, United Kingdom |
| 168 | University of Florida | Gainesville, United States |
| 169 | University of Reading | Reading, United Kingdom |
| 169 | University of Maryland, College Park | College Park, United States |
| 171 | Complutense University of Madrid | Madrid, Spain |
| 171 | University College Dublin | Dublin, Ireland |
| 173 | Qatar University | Doha, Qatar |
| 173 | University of Cape Town | Cape Town, South Africa |
| 173 | The University of Newcastle, Australia (UON) | Callaghan, Australia |
| 176 | Erasmus University Rotterdam | Rotterdam, Netherlands |
| 176 | Nagoya University | Nagoya, Japan |
| 176 | University of Liverpool | Liverpool, United Kingdom |
| 179 | Arizona State University | Tempe, United States |
| 180 | Université catholique de Louvain (UCLouvain) | Louvain-la-Neuve, Belgium |
| 180 | King Fahd University of Petroleum & Minerals | Dhahran, Saudi Arabia |
| 182 | University of Calgary | Calgary, Canada |
| 183 | Curtin University | Perth, Australia |
| 184 | Technische Universität Wien | Vienna, Austria |
| 184 | Tecnológico de Monterrey | Monterrey, Mexico |
| 184 | École Normale Supérieure de Lyon | Lyon, France |
| 187 | University of Gothenburg | Gothenburg, Sweden |
| 188 | Universiti Teknologi Malaysia | Skudai, Malaysia |
| 189 | McMaster University | Hamilton, Canada |
| 189 | Universite libre de Bruxelles | Brussels, Belgium |
| 189 | Queensland University of Technology (QUT) | Brisbane, Australia |
| 192 | Ecole des Ponts ParisTech | Paris, France |
| 192 | Albert-Ludwigs-Universitaet Freiburg | Freiburg im Breisgau, Germany |
| 194 | Wuhan University | Wuhan, China (Mainland) |
| 195 | University of Minnesota Twin Cities | Minneapolis, United States |
| 196 | Hokkaido University | Sapporo, Japan |
| 197 | Indian Institute of Technology Delhi (IITD) | New Delhi, India |
| 198 | Universidad de los Andes | Bogotá, Colombia |
| 199 | Waseda University | Tokyo, Japan |
| 199 | Universidad Autónoma de Madrid | Madrid, Spain |
| 202 | Queen’s University Belfast | Belfast, United Kingdom |
| 203 | King Saud University | Riyadh, Saudi Arabia |
| 203 | University of Ottawa | Ottawa, Canada |
| 205 | Universität Hamburg | Hamburg, Germany |
| 206 | University of Otago | Dunedin, New Zealand |
| 207 | Vrije Universiteit Amsterdam | Amsterdam, Netherlands |
| 208 | University of Aberdeen | Aberdeen, United Kingdom |
| 209 | Queen’s University at Kingston | Kingston, Canada |
| 210 | University of Twente | Enschede, Netherlands |
| 211 | Chulalongkorn University | Bangkok, Thailand |
| 212 | Loughborough University | Loughborough, United Kingdom |
| 213 | Eberhard Karls Universität Tübingen | Tübingen, Germany |
| 214 | Keio University | Tokyo, Japan |
| 215 | Tel Aviv University | Tel Aviv, Israel |
| 216 | Tongji University | Shanghai, China (Mainland) |
| 217 | National Yang Ming Chiao Tung University | Hsinchu City, Taiwan |
| 218 | University of Sussex | Brighton, United Kingdom |
| 219 | Università di Padova | Padova, Italy |
| 220 | University of Lausanne | Lausanne, Switzerland |
| 220 | Universidade Estadual de Campinas (Unicamp) | Campinas, Brazil |
| 222 | University of Pittsburgh | Pittsburgh, United States |
| 222 | Radboud University | Nijmegen, Netherlands |
| 224 | University of Rochester | Rochester, United States |
| 225 | Indian Institute of Science | Bangalore, India |
| 226 | Universidad Nacional de Colombia | Bogotá, Colombia |
| 226 | American University of Beirut (AUB) | Beirut , Lebanon |
| 228 | National Cheng Kung University (NCKU) | Tainan City, Taiwan |
| 229 | Friedrich-Alexander-Universität Erlangen-Nürnberg | Erlangen, Germany |
| 230 | Al-Farabi Kazakh National University | Almaty, Kazakhstan |
| 230 | Khalifa University | Abu Dhabi, United Arab Emirates |
| 232 | University of Göttingen | Göttingen, Germany |
| 233 | National Tsing Hua University | Hsinchu City, Taiwan |
| 233 | Deakin University. | Burwood, Australia |
| 235 | Heriot-Watt University | Edinburgh, United Kingdom |
| 236 | Université Paris Cité | Paris, France |
| 237 | Dartmouth College | Hanover, United States |
| 237 | Universitas Indonesia | Depok, Indonesia |
| 239 | Massey University | Palmerston North, New Zealand |
| 239 | Rheinische Friedrich-Wilhelms-Universität Bonn | Bonn, Germany |
| 241 | Victoria University of Wellington | Kelburn, Wellington, New Zealand |
| 242 | La Trobe University | Melbourne, Australia |
| 243 | Griffith University | Nathan, Australia |
| 244 | University of Surrey | Guildford, United Kingdom |
| 245 | University of Massachusetts Amherst | Amherst, United States |
| 246 | Technische Universität Dresden | Dresden, Germany |
| 246 | Technical University of Darmstadt | Darmstadt, Germany |
| 248 | Charles University | Prague, Czechia |
| 248 | University of Antwerp | Antwerp, Belgium |
| 250 | University of Waikato | Hamilton , New Zealand |
| 251 | The Hebrew University of Jerusalem | Jerusalem, Israel |
| 252 | Politecnico di Torino | Turin, Italy |
| 253 | University of Porto | Porto, Portugal |
| 254 | University of Macau | null Macau SAR |
| 255 | Case Western Reserve University | Cleveland, United States |
| 256 | Maastricht University | Maastricht, Netherlands |
| 256 | Harbin Institute of Technology | Harbin, China (Mainland) |
| 256 | University of Canterbury | Te Whare Wānanga o Waitaha | Christchurch, New Zealand |
| 259 | Vrije Universiteit Brussel (VUB) | Brussels, Belgium |
| 260 | University of Virginia | Charlottesville, United States |
| 261 | Vanderbilt University | Nashville, United States |
| 262 | University of Warsaw | Warsaw, Poland |
| 263 | Gadjah Mada University | Yogyakarta, Indonesia |
| 264 | University of Witwatersrand | Johannesburg, South Africa |
| 264 | University of Colorado Boulder | Boulder, United States |
| 266 | Ulsan National Institute of Science and Technology (UNIST) | Ulsan, South Korea |
| 266 | University of Lisbon | Lisbon, Portugal |
| 268 | Linköping University | Linköping, Sweden |
| 268 | University of California, Irvine | Irvine, United States |
| 268 | University of Cologne | Cologne, Germany |
| 271 | Indian Institute of Technology Kharagpur (IIT-KGP) | Kharagpur, India |
| 272 | University of Leicester | Leicester, United Kingdom |
| 272 | Beijing Normal University | Beijing, China (Mainland) |
| 274 | North Carolina State University | Raleigh, United States |
| 275 | Huazhong University of Science and Technology | Wuhan, China (Mainland) |
| 276 | University of Milan | Milan, Italy |
| 276 | University of Strathclyde | Glasgow, United Kingdom |
| 278 | University of Miami | Miami, United States |
| 278 | Indian Institute of Technology Kanpur (IITK) | Kanpur, India |
| 280 | University of Navarra | Pamplona, Spain |
| 281 | University of Bergen | Bergen, Norway |
| 281 | Bandung Institute of Technology (ITB) | Bandung, Indonesia |
| 283 | Stellenbosch University | Stellenbosch, South Africa |
| 284 | Taylor’s University | Subang Jaya, Malaysia |
| 285 | The University of Arizona | Tucson, United States |
| 285 | Tianjin University | Tianjin, China (Mainland) |
| 285 | Swinburne University of Technology | Melbourne, Australia |
| 285 | Indian Institute of Technology Madras (IITM) | Chennai, India |
| 289 | University of Galway | Galway, Ireland |
| 290 | United Arab Emirates University | Al Ain, United Arab Emirates |
| 291 | Xi’an Jiaotong University | Xi’an, China (Mainland) |
| 292 | Norwegian University of Science And Technology | Trondheim, Norway |
| 292 | University College Cork | Cork, Ireland |
| 294 | Université Grenoble Alpes | Grenoble, France |
| 295 | University of East Anglia (UEA) | Norwich, United Kingdom |
| 295 | Hong Kong Baptist University | Hong Kong, Hong Kong SAR |
| 297 | Georgetown University | Washington D.C., United States |
| 298 | Dalhousie University | Halifax, Canada |
| 299 | Rutgers University–New Brunswick | New Brunswick, United States |
| 300 | UCSI University | Kuala Lumpur, Malaysia |
| 301 | Southern University of Science and Technology (SUSTech) | Shenzhen, China (Mainland) |
| 302 | Goethe-University Frankfurt am Main | Frankfurt, Germany |
| 302 | Virginia Polytechnic Institute and State University | Blacksburg, United States |
| 304 | University of Notre Dame | Notre Dame, United States |
| 304 | Jagiellonian University | Krakow, Poland |
| 306 | University of Johannesburg | Johannesburg, South Africa |
| 307 | Swansea University | Swansea, United Kingdom |
| 307 | Universiti Teknologi PETRONAS (UTP) | Seri Iskandar, Malaysia |
| 307 | University of Tasmania | Hobart, Australia |
| 310 | Hamad bin Khalifa University | Doha, Qatar |
| 310 | Universitat Pompeu Fabra (Barcelona) | Barcelona, Spain |
| 312 | Universität Stuttgart | Stuttgart, Germany |
| 313 | University of Oulu | Oulu, Finland |
| 313 | Indiana University Bloomington | Bloomington, United States |
| 315 | University of Turku | Turku, Finland |
| 315 | Saint Petersburg State University | Saint Petersburg, Russia |
| 315 | Quaid-i-Azam University | Islamabad, Pakistan |
| 318 | Simon Fraser University | Burnaby, Canada |
| 319 | Sciences Po | Paris, France |
| 319 | Bauman Moscow State Technical University | Moscow, Russia |
| 319 | Universidad Carlos III de Madrid (UC3M) | Madrid, Spain |
| 322 | University of Victoria (UVic) | Victoria, Canada |
| 323 | University of Pretoria | Pretoria, South Africa |
| 323 | Sun Yat-sen University | Guangzhou, China (Mainland) |
| 323 | University of Illinois at Chicago (UIC) | Chicago, United States |
| 326 | University of Southern Denmark (SDU) | Odense, Denmark |
| 326 | University of South Australia | Adelaide, Australia |
| 328 | Université Paris 1 Panthéon-Sorbonne | Paris, France |
| 328 | USI – Università della Svizzera italiana | Lugano, Switzerland |
| 328 | City, University of London | London, United Kingdom |
| 328 | Gwangju Institute of Science and Technology (GIST) | Gwangju, South Korea |
| 332 | Kyung Hee University | Seoul, South Korea |
| 332 | University of California, Santa Cruz | Santa Cruz, United States |
| 334 | Sharif University of Technology | Tehran, Iran |
| 335 | University of Naples – Federico II | Naples, Italy |
| 336 | Pontificia Universidad Catolica del Peru | Lima, Peru |
| 336 | University of Kent | Canterbury, United Kingdom |
| 336 | Middle East Technical University | Ankara, Turkey |
| 336 | Aalborg University | Aalborg, Denmark |
| 340 | George Washington University | Washington D.C., United States |
| 340 | Beijing Institute of Technology | Beijing, China (Mainland) |
| 342 | RUDN University | Moscow, Russia |
| 343 | Brunel University London | London, United Kingdom |
| 344 | University of Aveiro | Aveiro, Portugal |
| 345 | Airlangga University | Surabaya, Indonesia |
| 345 | University of Saskatchewan | Saskatoon, Canada |
| 347 | Pontificia Universidad Javeriana | Bogotá, Colombia |
| 347 | National Technical University of Athens | Athens, Greece |
| 349 | University of Pisa | Pisa, Italy |
| 349 | Universidad Politécnica de Madrid (UPM) | Madrid, Spain |
| 351 | Lappeenranta-Lahti University of Technology LUT | Lappeenranta, Finland |
| 351 | University of Coimbra | Coimbra, Portugal |
| 353 | York University | Toronto, Canada |
| 354 | Universitat Politècnica de Catalunya · BarcelonaTech (UPC) | Barcelona, Spain |
| 355 | University of Tsukuba | Tsukuba City, Japan |
| 355 | L.N. Gumilyov Eurasian National University (ENU) | Nur-Sultan, Kazakhstan |
| 355 | Sichuan University | Chengdu, China (Mainland) |
| 358 | University of Tartu | Tartu, Estonia |
| 358 | University of Florence | Florence, Italy |
| 360 | University of Tehran | Tehran, Iran |
| 360 | Shandong University | Jinan, China (Mainland) |
| 362 | Lincoln University | Lincoln, New Zealand |
| 362 | Universität Innsbruck | Innsbruck, Austria |
| 364 | University of Turin | Turin, Italy |
| 364 | American University of Sharjah | Sharjah, United Arab Emirates |
| 364 | Indian Institute of Technology Guwahati (IITG) | Guwahati, India |
| 367 | National University of Sciences And Technology (NUST) Islamabad | Islamabad, Pakistan |
| 368 | University of Cyprus (UCY) | Nicosia, Cyprus |
| 369 | Indian Institute of Technology Roorkee (IITR) | Roorkee, India |
| 369 | Yeshiva University | New York City, United States |
| 371 | Tilburg University | Tilburg, Netherlands |
| 371 | Universidade Federal do Rio de Janeiro | Rio de Janeiro, Brazil |
| 371 | Cairo University | Giza, Egypt |
| 374 | Birkbeck, University of London | London, United Kingdom |
| 375 | Amirkabir University of Technology | Tehran, Iran |
| 375 | Western Sydney University | Milperra, Australia |
| 375 | Northeastern University | Boston, United States |
| 375 | Ruhr-Universität Bochum | Bochum, Germany |
| 379 | Tufts University | Medford, United States |
| 380 | Flinders University | Adelaide, Australia |
| 381 | University of Luxembourg | Luxembourg, Luxembourg |
| 382 | Mahidol University | Nakhon Pathom, Thailand |
| 382 | Université de Montpellier | Montpellier, France |
| 384 | Nankai University | Tianjin, China (Mainland) |
| 384 | University of Münster | Munster, Germany |
| 386 | University of Hawaiʻi at Mānoa | Honolulu, United States |
| 387 | National Taiwan University of Science and Technology (Taiwan Tech) | Taipei City, Taiwan |
| 387 | Concordia University | Montreal, Canada |
| 387 | Belarusian State University | Minsk, Belarus |
| 387 | Aix-Marseille University | Marseille, France |
| 387 | Universiti Brunei Darussalam (UBD) | Bandar Seri Begawan, Brunei |
| 392 | Xiamen University | Xiamen, China (Mainland) |
| 392 | Institut National des Sciences Appliquées de Lyon (INSA) | Lyon, France |
| 392 | Technion – Israel Institute of Technology | Haifa, Israel |
| 392 | South China University of Technology | Guangzhou, China (Mainland) |
| 396 | Stony Brook University, State University of New York | Stony Brook, United States |
| 396 | Kazan (Volga region) Federal University | Kazan, Russia |
| 396 | Justus-Liebig-University Giessen | Giessen, Germany |
| 399 | HSE University | Moscow, Russia |
| 400 | Universidade Nova de Lisboa | Lisbon, Portugal |
| 400 | Masaryk University | Brno, Czechia |
| 400 | Iowa State University | Ames, United States |
| 403 | University of Granada | Granada, Spain |
| 404 | University of California, Riverside | Riverside, United States |
| 404 | University of the Philippines | Quezon City, Philippines |
| 404 | Istanbul Technical University | Maslak-Istanbul, Turkey |
| 407 | University of Delhi | New Delhi, India |
| 407 | Auckland University of Technology (AUT) | Auckland, New Zealand |
| 409 | Colorado State University | Fort Collins, United States |
| 410 | University of Southern Queensland | Toowoomba, Australia |
| 410 | Universidad de Santiago de Chile (USACH) | Santiago, Chile |
| 410 | University of Kansas | Lawrence, United States |
| 413 | Oxford Brookes University | Oxford, United Kingdom |
| 413 | Royal Holloway University of London | Egham, United Kingdom |
| 415 | James Cook University | Townsville, Australia |
| 415 | Moscow Institute of Physics and Technology (MIPT / Moscow Phystech) | Dolgoprudny, Russia |
| 415 | The American University in Cairo | Cairo, Egypt |
| 418 | Tomsk State University | Tomsk, Russia |
| 419 | UNESP | Sao Paulo, Brazil |
| 419 | Washington State University | Pullman, United States |
| 421 | Université de Strasbourg | Strasbourg, France |
| 421 | Novosibirsk State University | Novosibirsk , Russia |
| 421 | Université de Liège | Liège, Belgium |
| 421 | Graz University of Technology | Graz, Austria |
| 421 | University of Canberra | Bruce, Australia |
| 426 | University of Limerick | Limerick, Ireland |
| 427 | Anna University | Chennai, India |
| 428 | IE University | Segovia, Spain |
| 429 | University of Trento | Trento, Italy |
| 429 | Singapore University of Technology and Design | Singapore, Singapore |
| 431 | National Taipei University of Technology | Taipei City, Taiwan |
| 431 | National Taiwan Normal University | Taipei City, Taiwan |
| 431 | University of Stirling | Stirling, United Kingdom |
| 431 | Murdoch University | Murdoch, Australia |
| 431 | Koç University | Istanbul, Turkey |
| 436 | Tampere University | Tampere, Finland |
| 436 | University of St.Gallen (HSG) | St. Gallen, Switzerland |
| 436 | Sejong University | Seoul, South Korea |
| 436 | Dublin City University | Dublin, Ireland |
| 436 | University of Science and Technology Beijing | Beijing, China (Mainland) |
| 441 | University of Utah | Salt Lake City, United States |
| 441 | Université Laval | Québec, Canada |
| 441 | University of Dundee | Dundee, United Kingdom |
| 444 | University of Connecticut | Storrs, United States |
| 444 | National and Kapodistrian University of Athens | Athens, Greece |
| 446 | Toyota Technological Institute | Nagoya, Japan |
| 446 | Johannes Kepler University Linz | Linz, Austria |
| 446 | The University of Tennessee, Knoxville | Knoxville, United States |
| 446 | University of Jyväskylä | Jyväskylä, Finland |
| 446 | Aston University | Birmingham, United Kingdom |
| 451 | Iran University of Science and Technology | Tehran, Iran |
| 452 | Université Claude Bernard Lyon 1 | Villeurbanne, France |
| 452 | Central South University | Changsha Shi, China (Mainland) |
| 454 | Czech Technical University in Prague | Prague, Czechia |
| 454 | Southeast University | Nanjing, China (Mainland) |
| 454 | Sultan Qaboos University | Muscat, Oman |
| 454 | Universität Mannheim | Mannheim, Germany |
| 454 | Indian Institute of Technology Indore | Indore, India |
| 459 | Essex, University of | Colchester, United Kingdom |
| 460 | Universität Potsdam | Potsdam, Germany |
| 461 | Florida State University | Tallahassee, United States |
| 461 | National Research Nuclear University MEPhI (Moscow Engineering Physics Institute) | Moscow, Russia |
| 461 | Universität Jena | Jena, Germany |
| 464 | Johannes Gutenberg Universität Mainz | Mainz, Germany |
| 465 | Umea University | Umeå, Sweden |
| 465 | University of Bordeaux | Talence, France |
| 465 | University of Sharjah | Sharjah, United Arab Emirates |
| 465 | Colorado School of Mines | Golden, United States |
| 469 | Università degli Studi di Pavia | Pavia, Italy |
| 469 | Illinois Institute of Technology | Chicago, United States |
| 469 | Ben-Gurion University of The Negev | Be’er Sheva, Israel |
| 472 | Hiroshima University | Higashihiroshima City, Japan |
| 473 | Vilnius University | Vilnius, Lithuania |
| 473 | Ural Federal University – UrFU | Ekaterinburg, Russia |
| 473 | Beihang University (former BUAA) | Beijing, China (Mainland) |
| 476 | Universitat Politecnica de Valencia | València, Spain |
| 476 | Kobe University | Kobe City, Japan |
| 478 | Universität Konstanz | Konstanz, Germany |
| 479 | Universität Leipzig | Leipzig, Germany |
| 480 | Missouri University of Science and Technology | Rolla, United States |
| 481 | Hitotsubashi University | Kunitachi City, Japan |
| 481 | Leibniz University Hannover | Hanover, Germany |
| 481 | Bangor University | Bangor, United Kingdom |
| 481 | Satbayev University | Almaty, Kazakhstan |
| 485 | Universitat de Valencia | València, Spain |
| 486 | University of Guelph | Guelph, Canada |
| 486 | University of Electronic Science and Technology of China | Chengdu, China (Mainland) |
| 489 | University of Rome “Tor Vergata” | Rome, Italy |
| 489 | IPB University (aka Bogor Agricultural University) | Bogor, Indonesia |
| 491 | University of Iowa | Iowa City, United States |
| 491 | Dalian University of Technology | Dalian, China (Mainland) |
| 491 | University at Buffalo SUNY | Buffalo, United States |
| 494 | Rensselaer Polytechnic Institute | Troy, United States |
| 494 | Universidad de Sevilla | Seville, Spain |
| 494 | Chung-Ang University (CAU) | Seoul, South Korea |
| 494 | Hunan University | Changsha, China (Mainland) |
| 498 | Ewha Womans University | Seoul, South Korea |
| 498 | University of Delaware | Newark, United States |
| 498 | Ulster University | Coleraine, United Kingdom |
| 498 | University of Jordan | Amman, Jordan |
| 502 | University of Portsmouth | Portsmouth, United Kingdom |
| 502 | Jilin University | Changchun, China (Mainland) |
| 502 | Bilkent University | Ankara, Turkey |
| 505 | Università Cattolica del Sacro Cuore | Milan, Italy |
| 505 | Macau University of Science and Technology | Macau, Macau SAR |
| 505 | National Sun Yat-sen University | Kaohsiung City, Taiwan |
| 505 | Oregon State University | Corvallis, United States |
| 509 | Sogang University | Seoul, South Korea |
| 509 | University of Bayreuth | Bayreuth, Germany |
| 511 | Université Paul Sabatier Toulouse III | Toulouse, France |
| 511 | East China Normal University | Shanghai, China (Mainland) |
| 511 | SOAS University of London | London, United Kingdom |
| 514 | Shanghai University | Shanghai, China (Mainland) |
| 514 | Bogaziçi Üniversitesi | Istanbul, Turkey |
| 514 | Duy Tan University | Da Nang, Vietnam |
| 514 | Pontificia Universidad Católica Argentina | Buenos Aires, Argentina |
| 514 | Universität Bremen | Bremen, Germany |
| 514 | The University of Georgia | Athens, United States |
| 520 | University of Texas Dallas | Richardson, United States |
| 520 | Universidad Austral | Pilar, Argentina |
| 520 | Kyungpook National University | Daegu, South Korea |
| 523 | Universidad de Zaragoza | Zaragoza, Spain |
| 523 | University of Hull | Hull, United Kingdom |
| 525 | Universiti Teknologi Brunei | Bandar Seri Begawan, Brunei |
| 526 | MGIMO University | Moscow, Russia |
| 526 | Sabanci University | Istanbul, Turkey |
| 526 | University of Madras | Chennai, India |
| 529 | Edith Cowan University | Joondalup, Australia |
| 530 | Aristotle University of Thessaloniki | Thessaloniki, Greece |
| 530 | Christian-Albrechts-University zu Kiel | Kiel, Germany |
| 530 | University of Genoa | Genoa, Italy |
| 530 | Universidad de Palermo (UP) | Buenos Aires, Argentina |
| 534 | Peter the Great St. Petersburg Polytechnic University | St. Petersburg, Russia |
| 534 | University of Salamanca | Salamanca, Spain |
| 534 | University of Crete | Heraklion, Greece |
| 534 | China Agricultural University | Beijing, China (Mainland) |
| 538 | Universiti Utara Malaysia (UUM) | Sintok, Malaysia |
| 538 | Universidad de Alcalá | Alcalá de Henares, Spain |
| 540 | Lahore University of Management Sciences (LUMS) | Lahore, Pakistan |
| 540 | Universidad Nacional de La Plata (UNLP) | La Plata, Argentina |
| 542 | Ulm University | Ulm, Germany |
| 542 | ITMO University | St. Petersburg, Russia |
| 544 | Universidad de Costa Rica | San Jose, Costa Rica |
| 545 | Singapore Management University | Singapore, Singapore |
| 545 | Bar-Ilan University | Ramat Gan, Israel |
| 545 | City University of New York | New York City, United States |
| 548 | Northumbria University at Newcastle | Newcastle upon Tyne, United Kingdom |
| 548 | University of Eastern Finland | Kuopio, Finland |
| 548 | Lehigh University | Bethlehem, United States |
| 551 | University of Nebraska – Lincoln | Lincoln, United States |
| 551 | Canadian University Dubai | Dubai, United Arab Emirates |
| 551 | Hasselt University | Diepenbeek, Belgium |
| 551 | Ajman University | Ajman, United Arab Emirates |
| 555 | Universiti Teknologi MARA – UiTM | Shah Alam, Malaysia |
| 556 | University of Chemistry and Technology, Prague | Prague, Czechia |
| 556 | INTI International University | Nilai, Malaysia |
| 556 | Florida International University | Miami, United States |
| 556 | Renmin (People’s) University of China | Beijing, China (Mainland) |
| 556 | Politecnico di Bari | Bari, Italy |
| 561 | University of Plymouth | Plymouth, United Kingdom |
| 561 | Chongqing University | Chongqing, China (Mainland) |
| 563 | University of South Florida | Tampa, United States |
| 563 | Ateneo de Manila University | Quezon City, Philippines |
| 563 | Université de Fribourg | Fribourg, Switzerland |
| 567 | National Chengchi University | Taipei City, Taiwan |
| 567 | Universidad Adolfo Ibáñez | Santiago, Chile |
| 567 | University of Huddersfield | Huddersfield, United Kingdom |
| 567 | Bond University | Gold Coast, Australia |
| 571 | Warsaw University of Technology | Warsaw, Poland |
| 571 | Indian Institute of Technology BHU Varanasi (IIT BHU Varanasi) | Varanasi, India |
| 571 | Coventry University | Coventry, United Kingdom |
| 571 | Chiang Mai University | Chiang Mai, Thailand |
| 575 | HUFS – Hankuk (Korea) University of Foreign Studies | Seoul, South Korea |
| 575 | University of South Carolina | Columbia, United States |
| 577 | University of Tromsø The Arctic University of Norway | Tromsø, Norway |
| 577 | Taipei Medical University (TMU) | Taipei, Taiwan |
| 577 | Lebanese University | Beirut, Lebanon |
| 580 | University of Klagenfurt | Klagenfurt, Austria |
| 580 | Abu Dhabi University | Abu Dhabi, United Arab Emirates |
| 582 | Comillas Pontifical University | Madrid, Spain |
| 582 | Universidad Católica Andres Bello | Caracas City, Venezuela |
| 582 | Applied Science University – Bahrain | Al-Ekir, Bahrain |
| 586 | National Research Tomsk Polytechnic University | Tomsk, Russia |
| 586 | Sunway University | Petaling Jaya, Malaysia |
| 586 | University of Missouri, Columbia | Columbia, United States |
| 590 | Central Queensland University (CQUniversity Australia) | Norman Gardens, Australia |
| 590 | Manchester Metropolitan University | Manchester , United Kingdom |
| 590 | Prince Mohammad Bin Fahd university | Al Khobar, Saudi Arabia |
| 593 | University of Central Florida | Orlando, United States |
| 593 | Goldsmiths, University of London | London, United Kingdom |
| 595 | Shenzhen University | Shenzhen, China (Mainland) |
| 595 | Pontifícia Universidade Católica do Rio de Janeiro | Rio de Janeiro, Brazil |
| 595 | Nottingham Trent University | Nottingham, United Kingdom |
| 595 | Università Vita-Salute San Raffaele | Milan, Italy |
| 595 | Imam Abdulrahman Bin Faisal University (IAU) | Dammam, Saudi Arabia |
| 600 | Saarland University | Saarbrücken, Germany |
| 600 | Tulane University | New Orleans, United States |
| 600 | Nanjing University of Science and Technology | Nanjing, China (Mainland) |
| 600 | Thammasat University | Bangkok, Thailand |
| 601-610 | Abo Akademi University | Turku, Finland |
| 601-610 | University of Szeged | Szeged, Hungary |
| 601-610 | Drexel University | Philadelphia, United States |
| 601-610 | Jawaharlal Nehru University | New Delhi, India |
| 601-610 | Umm Al-Qura University | Makkah, Saudi Arabia |
| 601-610 | Kingston University, London | Kingston upon Thames, United Kingdom |
| 601-610 | American University in Dubai | Dubai, United Arab Emirates |
| 601-610 | Universidad de Concepción | Concepción, Chile |
| 601-610 | Charles Darwin University | Casuarina, Australia |
| 611-620 | Tokyo Medical and Dental University (TMDU) | Tokyo, Japan |
| 611-620 | National Central University | Taoyuan City, Taiwan |
| 611-620 | Auezov South Kazakhstan University (SKU) | Shymkent, Kazakhstan |
| 611-620 | Martin-Luther-Universität Halle-Wittenberg | Halle, Germany |
| 611-620 | Pusan National University | Busan, South Korea |
| 611-620 | Brno University of Technology | Brno, Czechia |
| 611-620 | University of Minho | Braga, Portugal |
| 611-620 | Al Ain University | Al Ain,, United Arab Emirates |
| 621-630 | Zhengzhou University | Zhengzhou, China (Mainland) |
| 621-630 | Northwestern Polytechnical University | Xi’an, China (Mainland) |
| 621-630 | Chang Gung University | Taoyuan City, Taiwan |
| 621-630 | Institut Teknologi Sepuluh Nopember (ITS Surabaya) | Surabaya, Indonesia |
| 621-630 | Management and Science University | Shah Alam, Malaysia |
| 621-630 | University of Kwazulu-Natal | Pinetown, South Africa |
| 621-630 | University of Ljubljana | Ljubljana, Slovenia |
| 621-630 | University of the Basque Country | Leioa, Spain |
| 621-630 | Asia Pacific University of Technology and Innovation (APU) Malaysia | Kuala Lumpur, Malaysia |
| 621-630 | Stevens Institute of Technology | Hoboken, United States |
| 621-630 | Universitat Ramon Llull | Barcelona, Spain |
| 631-640 | Ajou University | Suwon, South Korea |
| 631-640 | Palacký University Olomouc | Olomouc,, Czechia |
| 631-640 | Université de Lille | Lille, France |
| 631-640 | Ritsumeikan University | Kyoto, Japan |
| 631-640 | Jinan University (China) | Guangzhou, China (Mainland) |
| 631-640 | Boston College | Chestnut Hill, United States |
| 631-640 | Universidad Central de Venezuela | Caracas, Venezuela |
| 631-640 | Saint Joseph University of Beirut (USJ) | Beirut, Lebanon |
| 631-640 | University of New Mexico | Albuquerque, United States |
| 641-650 | University of Windsor | Windsor, Canada |
| 641-650 | Far Eastern Federal University | Vladivostok, Russia |
| 641-650 | Memorial University of Newfoundland | St. John’s, Canada |
| 641-650 | University of Oklahoma | Norman, United States |
| 641-650 | New Jersey Institute of Technology (NJIT) | Newark, United States |
| 641-650 | The New School | New York, United States |
| 641-650 | University of Modena and Reggio Emilia | Modena, Italy |
| 641-650 | Pakistan Institute of Engineering and Applied Sciences (PIEAS) | Islamabad, Pakistan |
| 641-650 | University of Houston | Houston, United States |
| 641-650 | Lingnan University, Hong Kong | Hong Kong, Hong Kong SAR |
| 641-650 | Universidad de La Habana | Havana, Cuba |
| 641-650 | University of Bradford | Bradford, United Kingdom |
| 641-650 | Free University of Bozen-Bolzano | Bolzano, Italy |
| 641-650 | Kazakh National Agrarian Research University KazNARU | Almaty, Kazakhstan |
| 651-660 | Tallinn University of Technology (TalTech) | Tallinn, Estonia |
| 651-660 | University of Hohenheim | Stuttgart, Germany |
| 651-660 | Universidad de Montevideo (UM) | Montevideo, Uruguay |
| 651-660 | Instituto Tecnológico Autónomo de México (ITAM) | Mexico City, Mexico |
| 651-660 | Southern Cross University | Lismore, Australia |
| 651-660 | COMSATS University Islamabad | Islamabad, Pakistan |
| 651-660 | University of Haifa | Haifa, Israel |
| 661-670 | Brandeis University | Waltham, United States |
| 661-670 | Ca’ Foscari University of Venice | Venice, Italy |
| 661-670 | Universitat Rovira i Virgili | Tarragona, Spain |
| 661-670 | National Chung Hsing University | Taichung City, Taiwan |
| 661-670 | Princess Nourah bint Abdulrahman University | Riyadh, Saudi Arabia |
| 661-670 | Università degli Studi di Perugia | Perugia, Italy |
| 661-670 | Universidad Panamericana (UP) | Mexico City, Mexico |
| 661-670 | Middlesex University | London, United Kingdom |
| 661-670 | Tokyo University of Science | Kagurazaka, Japan |
| 661-670 | Holy Spirit University of Kaslik | Jounieh, Lebanon |
| 661-670 | Karl-Franzens-Universitaet Graz | Graz, Austria |
| 661-670 | Lebanese American University | Byblos, Lebanon |
| 661-670 | Universitas Padjadjaran (UNPAD) | Bandung, Indonesia |
| 661-670 | Aberystwyth University | Aberystwyth, United Kingdom |
| 671-680 | University of Manitoba | Winnipeg, Canada |
| 671-680 | Dongguk University | Seoul, South Korea |
| 671-680 | Carleton University | Ottawa, Canada |
| 671-680 | University of Greenwich | Greenwich, United Kingdom |
| 671-680 | American University of the Middle East | Egaila, Kuwait |
| 671-680 | University of Debrecen | Debrecen, Hungary |
| 681-690 | Pontificia Universidad Católica de Valparaíso | Valparaíso, Chile |
| 681-690 | Soochow University | Suzhou, China (Mainland) |
| 681-690 | Shiraz University | Shiraz, Iran |
| 681-690 | East China University of Science and Technology | Shanghai, China (Mainland) |
| 681-690 | Paris Lodron University of Salzburg | Salzburg , Austria |
| 681-690 | The National University of Science and Technology MISIS | Moscow, Russia |
| 681-690 | El Colegio de México, A.C. | Mexico City, Mexico |
| 681-690 | De La Salle University | Manila, Philippines |
| 681-690 | University of Kentucky | Lexington, United States |
| 681-690 | Taras Shevchenko National University of Kyiv | Kyiv, Ukraine |
| 681-690 | Abai Kazakh National Pedagogical University | Almaty, Kazakhstan |
| 691-700 | University of Trieste | Trieste, Italy |
| 691-700 | Indian Institute of Technology Hyderabad (IITH) | Sangareddy, India |
| 691-700 | Universidade Federal do Rio Grande Do Sul | Porto Alegre, Brazil |
| 691-700 | University of Mons | Mons, Belgium |
| 691-700 | Universidad Iberoamericana IBERO | Mexico City, Mexico |
| 691-700 | V. N. Karazin Kharkiv National University | Kharkiv, Ukraine |
| 691-700 | Inha University | Incheon, South Korea |
| 691-700 | University of Dhaka | Dhaka, Bangladesh |
| 691-700 | University of Cincinnati | Cincinnati, United States |
| 691-700 | Universidade Federal de Minas Gerais | Belo Horizonte, Brazil |
| 701-710 | Wake Forest University | Winston-Salem, United States |
| 701-710 | Universidade de Santiago de Compostela | Santiago de Compostela, Spain |
| 701-710 | Czech University of Life Sciences in Prague | Prague, Czechia |
| 701-710 | Universidad de Antioquia | Medellin, Colombia |
| 701-710 | Chiba University | Chiba City, Japan |
| 701-710 | Eötvös Loránd University | Budapest, Hungary |
| 701-710 | Altai State University | Barnaul, Russia |
| 701-710 | Zayed University | Abu Dhabi,, United Arab Emirates |
| 711-720 | Université de Rennes 1 | Rennes, France |
| 711-720 | Savitribai Phule Pune University | Pune, India |
| 711-720 | Victoria University | Melbourne, Australia |
| 711-720 | University of Westminster | London, United Kingdom |
| 711-720 | International Islamic University Malaysia (IIUM) | Kuala Lumpur, Malaysia |
| 711-720 | Istanbul University | Istanbul, Turkey |
| 711-720 | University of New Brunswick | Fredericton, Canada |
| 711-720 | Universidad del Rosario | Bogotá, Colombia |
| 711-720 | Beirut Arab University | Beirut, Lebanon |
| 711-720 | China University of Petroleum, Beijing | Beijing, China (Mainland) |
| 711-720 | University of Maryland, Baltimore County | Baltimore, United States |
| 721-730 | Temple University | Philadelphia, United States |
| 721-730 | Université Côte d’Azur | Nice, France |
| 721-730 | Université de Lorraine | Nancy, France |
| 721-730 | Jeonbuk National University | Jeonju, South Korea |
| 721-730 | Ton Duc Thang University | Ho Chi Minh City, Vietnam |
| 721-730 | University of Oregon | Eugene, United States |
| 721-730 | University of Colorado, Denver | Denver, United States |
| 721-730 | Ain Shams University in Cairo (ASU, Cairo) | Cairo, Egypt |
| 721-730 | University of Belgrade | Belgrade, Serbia |
| 721-730 | Beijing University of Chemical Technology | Beijing, China (Mainland) |
| 721-730 | Universita’ Politecnica delle Marche | Ancona, Italy |
| 731-740 | University of Siena | Siena, Italy |
| 731-740 | Universidade Federal de São Paulo | São Paulo, Brazil |
| 731-740 | Alfaisal University | Riyadh, Saudi Arabia |
| 731-740 | Adam Mickiewicz University, Poznań | Poznań, Poland |
| 731-740 | Bournemouth University | Poole, United Kingdom |
| 731-740 | Universidad EAFIT | Medellin, Colombia |
| 731-740 | National Technical University of Ukraine “Igor Sikorsky Kyiv Polytechnic Institute” | Kyiv, Ukraine |
| 731-740 | Jordan University of Science & Technology | Irbid, Jordan |
| 731-740 | Indian Institute of Technology Bhubaneswar | Bhubaneswar, India |
| 741-750 | Sofia University “St. Kliment Ohridski” | Sofia, Bulgaria |
| 741-750 | Universität Regensburg | Regensburg, Germany |
| 741-750 | Swarthmore College | Philadelphia, United States |
| 741-750 | University of the Punjab | Lahore, Pakistan |
| 741-750 | Jadavpur University | Kolkata, India |
| 741-750 | University of Agriculture, Faisalabad | Faisalabad, Pakistan |
| 741-750 | Instituto Politécnico Nacional (IPN) | Ciudad de México, Mexico |
| 741-750 | Budapest University of Technology and Economics | Budapest, Hungary |
| 741-750 | University of the West of England | Bristol, United Kingdom |
| 741-750 | University of Bari | Bari, Italy |
| 751-760 | University of Zagreb | Zagreb, Croatia |
| 751-760 | University of Ulsan | Ulsan, South Korea |
| 751-760 | Riga Technical University | Riga, Latvia |
| 751-760 | Université du Québec | Québec, Canada |
| 751-760 | University of Mumbai | Mumbai, India |
| 751-760 | Ahlia University | Manama, Bahrain |
| 751-760 | Liverpool John Moores University | Liverpool , United Kingdom |
| 751-760 | ISCTE-IUL | Lisbon, Portugal |
| 751-760 | Wayne State University | Detroit, United States |
| 751-760 | Technische Universität Braunschweig | Braunschweig, Germany |
| 751-760 | Universidad Externado de Colombia | Bogotá, Colombia |
| 751-760 | Kasetsart University | Bangkok, Thailand |
| 761-770 | Universität Rostock | Rostock, Germany |
| 761-770 | Virginia Commonwealth University | Richmond, United States |
| 761-770 | Philipps-Universität Marburg | Marburg, Germany |
| 761-770 | Universiti Tenaga Nasional (UNITEN) | Kajang, Malaysia |
| 761-770 | Universidad de Belgrano | Buenos Aires, Argentina |
| 761-770 | Hacettepe University | Ankara, Turkey |
| 761-770 | King Khalid University | Abha, Saudi Arabia |
| 771-780 | Shoolini University of Biotechnology and Management Sciences | Solan, India |
| 771-780 | Rutgers University–Newark | Newark, United States |
| 771-780 | Nantes Université | Nantes, France |
| 771-780 | Sechenov University | Moscow, Russia |
| 771-780 | Universidad ORT Uruguay | Montevideo, Uruguay |
| 771-780 | Chandigarh University | Mohali, India |
| 771-780 | Universidad Anáhuac México | Huixquilucan, Mexico |
| 771-780 | Universität Duisburg-Essen | Duisburg, Germany |
| 771-780 | University of Brighton | Brighton, United Kingdom |
| 771-780 | Comenius University Bratislava | Bratislava, Slovakia |
| 771-780 | University at Albany SUNY | Albany, United States |
| 781-790 | China University of Mining and Technology | Xuzhou, China (Mainland) |
| 781-790 | Khoja Akhmet Yassawi International Kazakh-Turkish University | Turkestan, Kazakhstan |
| 781-790 | National Institute of Technology, Tiruchirappalli | Tiruchirappalli, India |
| 781-790 | Syracuse University | Syracuse, United States |
| 781-790 | University of Northern British Columbia | Prince George, Canada |
| 781-790 | Nanjing Agricultural University | Nanjing, China (Mainland) |
| 781-790 | Universiti Malaysia Pahang | Kuantan, Malaysia |
| 781-790 | Keele University | Keele, United Kingdom |
| 781-790 | The Catholic University of Korea | Gyeonggi, South Korea |
| 781-790 | University of Alaska Fairbanks | Fairbanks, United States |
| 791-800 | American University | Washington D.C., United States |
| 791-800 | Diponegoro University | Semarang, Indonesia |
| 791-800 | Clarkson University | Potsdam, United States |
| 791-800 | University of Patras | Patras, Greece |
| 791-800 | Plekhanov Russian University of Economics | Moscow, Russia |
| 791-800 | Lanzhou University | Lanzhou, China (Mainland) |
| 791-800 | University of Engineering & Technology (UET) Lahore | Lahore, Pakistan |
| 791-800 | Instituto Tecnológico de Buenos Aires (ITBA) | Buenos Aires, Argentina |
| 791-800 | University of Brescia | Brescia, Italy |
| 791-800 | Universidad de La Sabana | Bogotá, Colombia |
| 801-850 | Yokohama City University | Yokohama City, Japan |
| 801-850 | China University of Geosciences | Wuhan, China (Mainland) |
| 801-850 | Clark University | Worcester, United States |
| 801-850 | Vilnius Gediminas Technical University (VILNIUS TECH) | Vilnius, Lithuania |
| 801-850 | Verona University | Verona, Italy |
| 801-850 | Universidad Técnica Federico Santa María (USM) | Valparaíso, Chile |
| 801-850 | Tokyo University of Agriculture and Technology | Tokyo, Japan |
| 801-850 | Ivane Javakhishvili Tbilisi State University | Tbilisi, Georgia |
| 801-850 | Université de Sherbrooke | Sherbrooke, Canada |
| 801-850 | Konkuk University | Seoul, South Korea |
| 801-850 | Jouf University | Sakaka, Saudi Arabia |
| 801-850 | University of Latvia | Riga, Latvia |
| 801-850 | Universidad San Francisco de Quito (USFQ) | Quito, Ecuador |
| 801-850 | Almaty Technological University | Provo, Kazakhstan |
| 801-850 | Poznan University of Life Sciences | Poznań, Poland |
| 801-850 | North-West University | Potchefstroom, South Africa |
| 801-850 | University of Pecs | Pécs, Hungary |
| 801-850 | Nanjing University of Aeronautics and Astronautics | Nanjing, China (Mainland) |
| 801-850 | Nagasaki University | Nagasaki City, Japan |
| 801-850 | Universidad de la República (Udelar) | Montevideo, Uruguay |
| 801-850 | Belarusian National Technical University (BNTU) | Minsk, Belarus |
| 801-850 | Australian Catholic University | Melbourne, Australia |
| 801-850 | Universidad Pontificia Bolivariana | Medellín, Colombia |
| 801-850 | Maynooth University | Maynooth, Ireland |
| 801-850 | University of Santo Tomas | Manila, Philippines |
| 801-850 | Universitas Brawijaya | Malang , Indonesia |
| 801-850 | Texas Tech University | Lubbock, United States |
| 801-850 | De Montfort University | Leicester, United Kingdom |
| 801-850 | University of Calcutta | Kolkata, India |
| 801-850 | Kaunas University of Technology | Kaunas, Lithuania |
| 801-850 | Vytautas Magnus University | Kaunas, Lithuania |
| 801-850 | Karaganda State Technical University | Karaganda, Kazakhstan |
| 801-850 | Universiti Tunku Abdul Rahman (UTAR) | Kampar, Malaysia |
| 801-850 | Immanuel Kant Baltic Federal University | Kaliningrad, Russia |
| 801-850 | University of Hyderabad | Hyderabad, India |
| 801-850 | Universidade Federal de Santa Catarina | Florianópolis, Brazil |
| 801-850 | University of Salerno | Fisciano, Italy |
| 801-850 | Edinburgh Napier University | Edinburgh, United Kingdom |
| 801-850 | University Duesseldorf | Düsseldorf, Germany |
| 801-850 | University of Dubai | Dubai, United Arab Emirates |
| 801-850 | Bangladesh University of Engineering and Technology | Dhaka, Bangladesh |
| 801-850 | Babes-Bolyai University | Cluj-Napoca, Romania |
| 801-850 | Universidad de San Andrés – UdeSA | Buenos Aires, Argentina |
| 801-850 | Universidade de Brasília | Brasília, Brazil |
| 801-850 | University of Massachusetts Boston | Boston, United States |
| 801-850 | Ritsumeikan Asia Pacific University | Beppu City, Japan |
| 801-850 | University of Balamand | Beirut, Lebanon |
| 801-850 | Beijing University of Technology | Beijing, China (Mainland) |
| 801-850 | Louisiana State University | Baton Rouge, United States |
| 801-850 | Charles Sturt University | Bathurst, Australia |
| 801-850 | Auburn University | Auburn, United States |
| 801-850 | Al-Ahliyya Amman University | Amman, Jordan |
| 801-850 | University of Alicante | Alicante, Spain |
| 851-900 | Huazhong Agricultural University | Wuhan, China (Mainland) |
| 851-900 | Wuhan University of Technology | Wuhan, China (Mainland) |
| 851-900 | Worcester Polytechnic Institute | Worcester, United States |
| 851-900 | Vellore Institute of Technology (VIT), Vellore, India | Vellore, India |
| 851-900 | Toronto Metropolitan University | Toronto, Canada |
| 851-900 | Oklahoma State University | Stillwater, United States |
| 851-900 | National Research Saratov State University | Saratov, Russia |
| 851-900 | Universidad Central “Marta Abreu” de Las Villas | Santa Clara, Cuba |
| 851-900 | University of Salford | Salford, United Kingdom |
| 851-900 | Southern Federal University | Rostov-on-Don, Russia |
| 851-900 | University of South Africa | Pretoria, South Africa |
| 851-900 | University of Parma | Parma, Italy |
| 851-900 | CY Cergy Paris University | Paris, France |
| 851-900 | Universite Paris-Pantheon-Assas | Paris, France |
| 851-900 | University of Palermo | Palermo, Italy |
| 851-900 | Niigata University | Niigata City, Japan |
| 851-900 | Queen Margaret University , Edinburgh | Musselburgh, United Kingdom |
| 851-900 | University of Malta | Msida, Malta |
| 851-900 | Universidad Católica del Uruguay (UCU) | Montevideo, Uruguay |
| 851-900 | Wesleyan University | Middletown, United States |
| 851-900 | University of Messina (UniME) | Messina, Italy |
| 851-900 | University of Maribor | Maribor, Slovenia |
| 851-900 | Kansas State University | Manhattan, United States |
| 851-900 | London South Bank University | London, United Kingdom |
| 851-900 | University of East London | London, United Kingdom |
| 851-900 | University of Lincoln | Lincoln, United Kingdom |
| 851-900 | Gulf University for Science and Technology | Kuwait City, Kuwait |
| 851-900 | Kuwait University | Kuwait City, Kuwait |
| 851-900 | Pavol Jozef Šafárik University in Košice | Košice, Slovakia |
| 851-900 | Karaganda Buketov University | Karaganda, Kazakhstan |
| 851-900 | Kanazawa University | Kanazawa, Japan |
| 851-900 | Michigan Technological University | Houghton, United States |
| 851-900 | King Faisal University | Hofuf, Saudi Arabia |
| 851-900 | University of Hertfordshire | Hatfield, United Kingdom |
| 851-900 | Chonnam National University | Gwangju, South Korea |
| 851-900 | Universidad de Guadalajara (UDG) | Guadalajara, Mexico |
| 851-900 | Gdańsk University of Technology | Gdańsk, Poland |
| 851-900 | Universita’ degli Studi di Ferrara | Ferrara, Italy |
| 851-900 | Technological University Dublin | Dublin, Ireland |
| 851-900 | TU Dortmund University | Dortmund, Germany |
| 851-900 | North South University | Dhaka, Bangladesh |
| 851-900 | Chungnam National University | Daejeon, South Korea |
| 851-900 | Clemson University | Clemson, United States |
| 851-900 | Catania University | Catania, Italy |
| 851-900 | Universidad Torcuato Di Tella | Buenos Aires, Argentina |
| 851-900 | University of Bucharest | Bucharest, Romania |
| 851-900 | Kyrgyz-Turkish Manas University | Bishkek, Kyrgyzstan |
| 851-900 | Beijing University of Posts and Telecommunications | Beijing, China (Mainland) |
| 851-900 | Georgia State University | Atlanta, United States |
| 851-900 | Addis Ababa University | Addis Ababa, Ethiopia |
| 901-950 | University of Wroclaw | Wroclaw, Poland |
| 901-950 | Wroclaw University of Science and Technology (WRUST) | Wroclaw , Poland |
| 901-950 | College of William and Mary | Williamsburg, United States |
| 901-950 | Universidade de Vigo | Vigo, Spain |
| 901-950 | D. Serikbayev East Kazakhstan Technical University | Ust-Kamenogorsk, Kazakhstan |
| 901-950 | Nicolaus Copernicus University | Toruń, Poland |
| 901-950 | Sophia University | Tokyo, Japan |
| 901-950 | Asia University Taiwan | Taichung City, Taiwan |
| 901-950 | Saint Louis University | St. Louis, United States |
| 901-950 | Donghua University | Shanghai, China (Mainland) |
| 901-950 | Sungshin Women’s University | Seoul, South Korea |
| 901-950 | Samara National Research University (Samara University) | Samara, Russia |
| 901-950 | Università degli studi Roma Tre | Rome, Italy |
| 901-950 | Riga Stradins University | Riga, Latvia |
| 901-950 | Pontificia Universidad Católica del Ecuador (PUCE) | Quito, Ecuador |
| 901-950 | Ocean University of China | Qingdao, China (Mainland) |
| 901-950 | University of Central Lancashire | Preston, United Kingdom |
| 901-950 | Okayama University | Okayama City, Japan |
| 901-950 | University of Murcia | Murcia, Spain |
| 901-950 | West Virginia University | Morgantown, United States |
| 901-950 | National Chung Cheng University | Minxiong Township, Taiwan |
| 901-950 | Universidad Autónoma Metropolitana (UAM) | Mexico City, Mexico |
| 901-950 | London Metropolitan University | London, United Kingdom |
| 901-950 | Universidade Católica Portuguesa – UCP | Lisbon, Portugal |
| 901-950 | Universidad Nacional Mayor de San Marcos | Lima, Peru |
| 901-950 | Kumamoto University | Kumamoto City, Japan |
| 901-950 | AGH University of Krakow | Krakow, Poland |
| 901-950 | Notre Dame University-Louaize NDU | Koura, Lebanon |
| 901-950 | National Technical University “Kharkiv Polytechnic Institute” | Kharkiv, Ukraine |
| 901-950 | Prince of Songkla University | Hat Yai, Thailand |
| 901-950 | Rhodes University | Grahamstown, South Africa |
| 901-950 | University of Denver | Denver, United States |
| 901-950 | UPES | Dehradun, India |
| 901-950 | Hallym University | Chuncheon, South Korea |
| 901-950 | Loyola University Chicago | Chicago, United States |
| 901-950 | Universidad ICESI | Cali, Colombia |
| 901-950 | University of Vermont | Burlington, United States |
| 901-950 | Qassim University | Buraydah, Saudi Arabia |
| 901-950 | Mendel University in Brno | Brno, Czechia |
| 901-950 | University of Alabama at Birmingham | Birmingham, United States |
| 901-950 | Beijing Jiaotong University | Beijing, China (Mainland) |
| 901-950 | Athens University of Economics and Business | Athens, Greece |
| 901-950 | Northern Borders University | Arar, Saudi Arabia |
| 901-950 | Ankara Üniversitesi | Ankara, Turkey |
| 901-950 | Princess Sumaya University for Technology | Amman, Jordan |
| 901-950 | Asfendiyarov Kazakh National Medical University | Almaty, Kazakhstan |
| 901-950 | Alexandria University | Alexandria, Egypt |
| 901-950 | Robert Gordon University | Aberdeen, United Kingdom |
| 951-1000 | University of Bahrain | Zallaq, Bahrain |
| 951-1000 | Yokohama National University | Yokohama City, Japan |
| 951-1000 | Northwest Agriculture and Forestry University | Yangling, China (Mainland) |
| 951-1000 | Universidad de Valladolid | Valladolid, Spain |
| 951-1000 | The University of Alabama | Tuscaloosa, United States |
| 951-1000 | Université de Tunis El Manar | Tunis, Tunisia |
| 951-1000 | Université Toulouse 1 Capitole | Toulouse, France |
| 951-1000 | Tokyo Metropolitan University | Tokyo, Japan |
| 951-1000 | Shahid Beheshti University (SBU) | Tehran, Iran |
| 951-1000 | Universiti Pendidikan Sultan Idris (UPSI) | Tanjong Malim, Malaysia |
| 951-1000 | Sumy State University | Sumy, Ukraine |
| 951-1000 | Saint Petersburg Electrotechnical University ETU-LETI | St. Petersburg, Russia |
| 951-1000 | O.P. Jindal Global University | Sonepat, India |
| 951-1000 | University of Seoul | Seoul, South Korea |
| 951-1000 | Universidad de los Andes – Chile | Santiago, Chile |
| 951-1000 | Universidad Diego Portales (UDP) | Santiago, Chile |
| 951-1000 | Universidad Peruana Cayetano Heredia (UPCH) | San Martin, Peru |
| 951-1000 | Universidad Nacional de Rosario (UNR) | Rosario, Argentina |
| 951-1000 | University of Calabria | Rende, Italy |
| 951-1000 | Birla Institute of Technology and Science, Pilani | Pilani, India |
| 951-1000 | University of Peshawar | Peshawar, Pakistan |
| 951-1000 | Thapar Institute of Engineering & Technology | Patiala, India |
| 951-1000 | Universidad Tecnológica de Panamá (UTP) | Panama City, Panama |
| 951-1000 | Jamia Millia Islamia | New Delhi, India |
| 951-1000 | Universidad Rey Juan Carlos | Móstoles, Spain |
| 951-1000 | Manipal Academy of Higher Education, Manipal, Karnataka, India | Manipal, India |
| 951-1000 | Gunma University | Maebashi, Japan |
| 951-1000 | Islamic University of Madinah | Madinah, Saudi Arabia |
| 951-1000 | Lviv Polytechnic National University | Lviv, Ukraine |
| 951-1000 | University of Lodz | Lodz, Poland |
| 951-1000 | Universidad Nacional de Ingeniería | Lima, Peru |
| 951-1000 | University of Ghana | Legon, Ghana |
| 951-1000 | Khon Kaen University | Khon Kaen, Thailand |
| 951-1000 | Makerere University | Kampala, Uganda |
| 951-1000 | Yildiz Technical University | Istanbul, Turkey |
| 951-1000 | Indiana University–Purdue University Indianapolis | Indianapolis, United States |
| 951-1000 | Viet Nam National University Ho Chi Minh City (VNU-HCM) | Ho Chi Minh City, Vietnam |
| 951-1000 | Vietnam National University, Hanoi | Hanoi, Vietnam |
| 951-1000 | Yeungnam University | Gyeongsan, South Korea |
| 951-1000 | Gifu University | Gifu City, Japan |
| 951-1000 | UNIVERSITY OF GDANSK | Gdańsk, Poland |
| 951-1000 | George Mason University | Fairfax, United States |
| 951-1000 | Universidad Nacional de Córdoba – UNC | Córdoba, Argentina |
| 951-1000 | Universidad de Castilla-La Mancha | Ciudad Real, Spain |
| 951-1000 | Universidad de las Américas Puebla (UDLAP) | Cholula, Mexico |
| 951-1000 | South Ural State University (National Research University) | Chelyabinsk, Russia |
| 951-1000 | Tecnológico de Costa Rica -TEC | Cartago, Costa Rica |
| 951-1000 | Universidad Simón Bolívar (USB) | Caracas, Venezuela |
| 951-1000 | University of the Western Cape | Cape Town, South Africa |
| 951-1000 | Bielefeld University | Bielefeld, Germany |
| 951-1000 | King Mongkut’s University of Technology Thonburi | Bangkok, Thailand |
| 951-1000 | University of Baghdad | Baghdad, Iraq |
| 951-1000 | University of New England Australia | Armidale, Australia |
| 951-1000 | NJSC KIMEP University | Almaty, Kazakhstan |
| 1001-1200 | Tomas Bata University in Zlin | Zlin, Czechia |
| 1001-1200 | University of Zilina | Zilina, Slovakia |
| 1001-1200 | Northwest University (China) | Xi’an, China (Mainland) |
| 1001-1200 | Jiangnan University | Wuxi, China (Mainland) |
| 1001-1200 | Howard University | Washington D.C., United States |
| 1001-1200 | Baylor University | Waco, United States |
| 1001-1200 | Università degli Studi della Tuscia (University of Tuscia) | Viterbo, Italy |
| 1001-1200 | Mykolas Romeris University | Vilnius, Lithuania |
| 1001-1200 | Banaras Hindu University | Varanasi, India |
| 1001-1200 | Universidad Austral de Chile | Valdivia, Chile |
| 1001-1200 | Ufa State Aviation Technical University (USATU) | Ufa, Russia |
| 1001-1200 | Università degli Studi di Udine | Udine, Italy |
| 1001-1200 | University of Tyumen | Tyumen, Russia |
| 1001-1200 | University of Tulsa | Tulsa, United States |
| 1001-1200 | Université Toulouse – Jean Jaurès | Toulouse, France |
| 1001-1200 | Universidad Autónoma del Estado de México (UAEMex) | Toluca de Lerdo, Mexico |
| 1001-1200 | University of Toledo | Toledo, United States |
| 1001-1200 | International Christian University | Tokyo, Japan |
| 1001-1200 | Meiji University | Tokyo, Japan |
| 1001-1200 | Tokushima University | Tokushima City, Japan |
| 1001-1200 | ITESO, Universidad Jesuita de Guadalajara | Tlaquepaque, Mexico |
| 1001-1200 | Universidad Autonoma Chapingo | Texcoco, Mexico |
| 1001-1200 | University of Wolverhampton | Telford, United Kingdom |
| 1001-1200 | Chung Yuan Christian University | Taoyuan City, Taiwan |
| 1001-1200 | Universidad Nacional del Centro de la Provincia de Buenos Aires (UNICEN) | Tandil, Argentina |
| 1001-1200 | Tallinn University | Tallinn, Estonia |
| 1001-1200 | Universidad de Talca | Talca, Chile |
| 1001-1200 | Chang Jung Christian University | Tainan City, Taiwan |
| 1001-1200 | Universitas Sebelas Maret | Surakarta, Indonesia |
| 1001-1200 | University of the Sunshine Coast | Sunshine Coast, Australia |
| 1001-1200 | Mississippi State University | Starkville, United States |
| 1001-1200 | Saint-Petersburg Mining University | St. Petersburg, Russia |
| 1001-1200 | Université de Sousse | Sousse, Tunisia |
| 1001-1200 | Universität Siegen | Siegen, Germany |
| 1001-1200 | Shanghai International Studies University | Shanghai, China (Mainland) |
| 1001-1200 | University of Sfax | Sfax, Tunisia |
| 1001-1200 | Dankook University | Seoul, South Korea |
| 1001-1200 | Kookmin University | Seoul, South Korea |
| 1001-1200 | Seoul National University of Science and Technology | Seoul, South Korea |
| 1001-1200 | Pontifícia Universidade Católica de São Paulo | São Paulo, Brazil |
| 1001-1200 | Universidade Federal de São Carlos (UFSCar) | São Paulo, Brazil |
| 1001-1200 | Instituto Tecnológico de Santo Domingo (INTEC) | Santo Domingo, Dominican Republic |
| 1001-1200 | Universidad Andrés Bello | Santiago, Chile |
| 1001-1200 | Universidad de Oriente, Santiago de Cuba | Santiago de Cuba, Cuba |
| 1001-1200 | Universidad de Monterrey (UDEM) | San Pedro Garza García, Mexico |
| 1001-1200 | Universidad Autónoma de Nuevo León | San Nicolás de los Garza, Mexico |
| 1001-1200 | Universidad Nacional de San Luis | San Luis , Argentina |
| 1001-1200 | Universidad Nacional de la Asunción | San Lorenzo, Paraguay |
| 1001-1200 | Universidad de Puerto Rico | San Juan, Puerto Rico |
| 1001-1200 | University of San Francisco | San Francisco, United States |
| 1001-1200 | San Diego State University | San Diego , United States |
| 1001-1200 | University of Texas at San Antonio | San Antonio, United States |
| 1001-1200 | Rochester Institute of Technology (RIT) | Rochester, United States |
| 1001-1200 | Imam Mohammad Ibn Saud Islamic University – IMSIU | Riyadh, Saudi Arabia |
| 1001-1200 | University of Regina | Regina, Canada |
| 1001-1200 | Universidade Federal de Pernambuco (UFPE) | Recife, Brazil |
| 1001-1200 | Escuela Politécnica Nacional | Quito, Ecuador |
| 1001-1200 | Brigham Young University | Provo, United States |
| 1001-1200 | Poznan University of Technology | Poznan, Poland |
| 1001-1200 | Université de Poitiers | Poitiers, France |
| 1001-1200 | University of Pardubice | Pardubice, Czechia |
| 1001-1200 | Universidad Autónoma del Estado de Hidalgo (UAEH) | Pachuca, Mexico |
| 1001-1200 | University of Mississippi | Oxford, United States |
| 1001-1200 | Universidad de Oviedo | Oviedo, Spain |
| 1001-1200 | VSB – Technical University of Ostrava | Ostrava, Czechia |
| 1001-1200 | Odessa I.I.Mechnikov National University | Odessa, Ukraine |
| 1001-1200 | Novosibirsk State Technical University | Novosibirsk, Russia |
| 1001-1200 | University of Novi Sad | Novi Sad, Serbia |
| 1001-1200 | The University of Northampton | Northampton, United Kingdom |
| 1001-1200 | Amity University | Noida, India |
| 1001-1200 | Lobachevsky University | Nizhny Novgorod, Russia |
| 1001-1200 | Harper Adams University | Newport, United Kingdom |
| 1001-1200 | Fordham University | New York City, United States |
| 1001-1200 | Future University in Egypt | New Cairo, Egypt |
| 1001-1200 | University of Naples Parthenope | Naples, Italy |
| 1001-1200 | Nanjing Normal University | Nanjing, China (Mainland) |
| 1001-1200 | Vancouver Island University | Nanaimo, Canada |
| 1001-1200 | University of Nairobi | Nairobi, Kenya |
| 1001-1200 | An-Najah National University | Nablus, Palestinian Territories |
| 1001-1200 | Mutah University | Mu’tah, Jordan |
| 1001-1200 | University of Idaho | Moscow, United States |
| 1001-1200 | Financial University under the Government of the Russian Federation | Moscow, Russia |
| 1001-1200 | Russian Presidential Academy of National Economy and Public Administration | Moscow, Russia |
| 1001-1200 | Paul Valéry University Montpellier | Montpellier, France |
| 1001-1200 | Universidad Peruana de Ciencias Aplicadas | Monterrico, Peru |
| 1001-1200 | University of Wisconsin Milwaukee | Milwaukee, United States |
| 1001-1200 | Universidad La Salle, México | Mexico City, Mexico |
| 1001-1200 | Universidad de Los Andes – (ULA) Mérida | Merida, Venezuela |
| 1001-1200 | Universidad Nacional de Cuyo | Mendoza, Argentina |
| 1001-1200 | Taibah University | Medina, Saudi Arabia |
| 1001-1200 | Shinshu University | Matsumoto City, Japan |
| 1001-1200 | Ferdowsi University of Mashhad | Mashhad, Iran |
| 1001-1200 | Mansoura University | Mansoura , Egypt |
| 1001-1200 | Universitas Hasanuddin | Makassar, Indonesia |
| 1001-1200 | CEU Universities | Madrid, Spain |
| 1001-1200 | Université Lumière Lyon 2 | Lyon, France |
| 1001-1200 | University of Louisville College of Business | Louisville, United States |
| 1001-1200 | Utah State University | Logan, United States |
| 1001-1200 | Lodz University of Technology | Lodz, Poland |
| 1001-1200 | Universitat de Lleida (University of Lleida) | Lleida, Spain |
| 1001-1200 | Universidad de Lima | Lima, Peru |
| 1001-1200 | Technical University of Liberec | Liberec, Czechia |
| 1001-1200 | Universidad de León | León, Spain |
| 1001-1200 | Leeds Beckett University | Leeds, United Kingdom |
| 1001-1200 | University of Salento | Lecce (LE), Italy |
| 1001-1200 | University of Wyoming | Laramie, United States |
| 1001-1200 | The University of Lahore | Lahore, Pakistan |
| 1001-1200 | Doshisha University | Kyoto, Japan |
| 1001-1200 | Kyoto Institute of Technology | Kyoto, Japan |
| 1001-1200 | National University of Kyiv-Mohyla Academy (NaUKMA) | Kyiv, Ukraine |
| 1001-1200 | Universiti Malaysia Sarawak (UNIMAS) | Kuching, Malaysia |
| 1001-1200 | Universiti Malaysia Terengganu (UMT) | Kuala Terengganu, Malaysia |
| 1001-1200 | Universiti Kuala Lumpur (UniKL) | Kuala Lumpur , Malaysia |
| 1001-1200 | Siberian Federal University, SibFU | Krasnoyarsk, Russia |
| 1001-1200 | Cracow University of Technology (Politechnika Krakowska) | Krakow, Poland |
| 1001-1200 | Universiti Malaysia Sabah (UMS) | Kota Kinabalu, Malaysia |
| 1001-1200 | Technical University of Kosice | Košice, Slovakia |
| 1001-1200 | University of Primorska | Koper, Slovenia |
| 1001-1200 | Kyushu Institute of Technology | Kitakyushu, Japan |
| 1001-1200 | University of Rhode Island | Kingston, United States |
| 1001-1200 | Kent State University | Kent, United States |
| 1001-1200 | Kazan National Research Technological University | Kazan, Russia |
| 1001-1200 | University of Karachi | Karachi, Pakistan |
| 1001-1200 | University of Missouri, Kansas City | Kansas City, United States |
| 1001-1200 | Universiti Malaysia Perlis | Kangar, Malaysia |
| 1001-1200 | Kagoshima University | Kagoshima City, Japan |
| 1001-1200 | Universidad del Pacífico | Jesús María, Peru |
| 1001-1200 | Bina Nusantara University (BINUS) | Jakarta, Indonesia |
| 1001-1200 | EGE UNIVERSITY | İzmir, Turkey |
| 1001-1200 | University of Ioannina | Ioannina, Greece |
| 1001-1200 | University of Hradec Kralove | Hradec Králové, Czechia |
| 1001-1200 | Tokai University | Hiratsuka City, Japan |
| 1001-1200 | Universidad Nacional Costa Rica | Heredia, Costa Rica |
| 1001-1200 | Harbin Engineering University | Harbin, China (Mainland) |
| 1001-1200 | Szechenyi Istvan University (University of Gyor) | Győr, Hungary |
| 1001-1200 | Escuela Superior Politécnica del Litoral (ESPOL) | Guayaquil, Ecuador |
| 1001-1200 | Universidad Autónoma de Guadalajara (UAG) | Guadalajara, Mexico |
| 1001-1200 | Silesian University of Technology | Gliwice, Poland |
| 1001-1200 | Glasgow Caledonian University | Glasgow, United Kingdom |
| 1001-1200 | Northern Arizona University | Flagstaff, United States |
| 1001-1200 | University of Arkansas Fayetteville | Fayetteville, United States |
| 1001-1200 | Sheffield Hallam University | false false |
| 1001-1200 | University of Texas El Paso | El Paso, United States |
| 1001-1200 | Al-Quds University | East Jerusalem, Palestinian Territories |
| 1001-1200 | University of New Hampshire | Durham, United States |
| 1001-1200 | BRAC University | Dhaka, Bangladesh |
| 1001-1200 | University of Derby | Derby, United Kingdom |
| 1001-1200 | University of North Texas | Denton, United States |
| 1001-1200 | Southern Methodist University | Dallas, United States |
| 1001-1200 | Multimedia University (MMU) | Cyberjaya, Malaysia |
| 1001-1200 | Universidade Federal do Paraná – UFPR | Curitiba, Brazil |
| 1001-1200 | Universidad de Córdoba | Córdoba, Spain |
| 1001-1200 | University of Colombo | Colombo,, Sri Lanka |
| 1001-1200 | Kangwon National University | Chuncheon, South Korea |
| 1001-1200 | Southwest University | Chongqing, China (Mainland) |
| 1001-1200 | Universita’ degli Studi “G. d’Annunzio” Chieti Pescara | Chieti, Italy |
| 1001-1200 | Chungbuk National University | Cheongju, South Korea |
| 1001-1200 | Sathyabama Institute of Science and Technology (Deemed to be University) | Chennai, India |
| 1001-1200 | University of North Carolina at Charlotte | Charlotte, United States |
| 1001-1200 | Panjab University | Chandigarh, India |
| 1001-1200 | University of South Bohemia in České Budějovice | České Budějovice, Czechia |
| 1001-1200 | Universidad Metropolitana | Caracas, Venezuela |
| 1001-1200 | Universidad del Valle | Cali, Colombia |
| 1001-1200 | Université de Caen Normandie | Caen, France |
| 1001-1200 | Universidad Tecnológica Nacional (UTN) | Buenos Aires, Argentina |
| 1001-1200 | Corvinus University of Budapest | Budapest, Hungary |
| 1001-1200 | MATE Hungarian University of Agriculture and Life Sciences | Budapest, Hungary |
| 1001-1200 | Universidad Industrial de Santander – UIS | Bucaramanga, Colombia |
| 1001-1200 | Slovak University of Technology in Bratislava | Bratislava, Slovakia |
| 1001-1200 | University of the Free State | Bloemfontein, South Africa |
| 1001-1200 | Birmingham City University | Birmingham, United Kingdom |
| 1001-1200 | Binghamton University SUNY | Binghamton, United States |
| 1001-1200 | University of Deusto | Bilbao, Spain |
| 1001-1200 | Canterbury Christ Church University | Bexleyheath, United Kingdom |
| 1001-1200 | Beijing Foreign Studies University | Beijing, China (Mainland) |
| 1001-1200 | Beijing University of Chinese Medicine | Beijing, China (Mainland) |
| 1001-1200 | Universiti Tun Hussein Onn Malaysia (UTHM) | Batu Pahat, Malaysia |
| 1001-1200 | Universidad del Norte | Barranquilla, Colombia |
| 1001-1200 | Telkom University | Bandung, Indonesia |
| 1001-1200 | Azerbaijan State University of Economics | Baku, Azerbaijan |
| 1001-1200 | Baku State University | Baku, Azerbaijan |
| 1001-1200 | Mustansiriyah University | Baghdad, Iraq |
| 1001-1200 | Ohio University | Athens, United States |
| 1001-1200 | Assiut University | Asyut, Egypt |
| 1001-1200 | Soonchunhyang University | Asan, South Korea |
| 1001-1200 | The University of Texas at Arlington | Arlington, United States |
| 1001-1200 | Gazi Üniversitesi | Ankara, Turkey |
| 1001-1200 | Amrita Vishwa Vidyapeetham | Amritapuri, India |
| 1001-1200 | German Jordanian University | Amman, Jordan |
| 1001-1200 | Kazakh Ablai Khan University of International Relations and World Languages | Almaty, Kazakhstan |
| 1001-1200 | Kazakh-British Technical University | Almaty, Kazakhstan |
| 1001-1200 | Aligarh Muslim University | Aligarh, India |
| 1001-1200 | Arab Academy for Science, Technology and Maritime Transport (AASTMT) | Alexandria, Egypt |
| 1001-1200 | Universidade da Coruña | A Coruña, Spain |