< Top 1,200 university list can be found at the bottom of this page >
This year’s edition includes 1,500 institutions. QS World University Rankings 2024 introduces three new indicators to reflect the changing priorities of students and the evolving missions of world-class higher education institutions today: a commitment to sustainability; even greater emphasis on supporting graduate employability and increased international research collaboration to solve the world’s biggest challenges.
~ Our “Elite Program” can help students enter these world-famous schools – please contact our center today (free enquiry: Tel 2391-9713, WhatsApp 5531-1001). ~
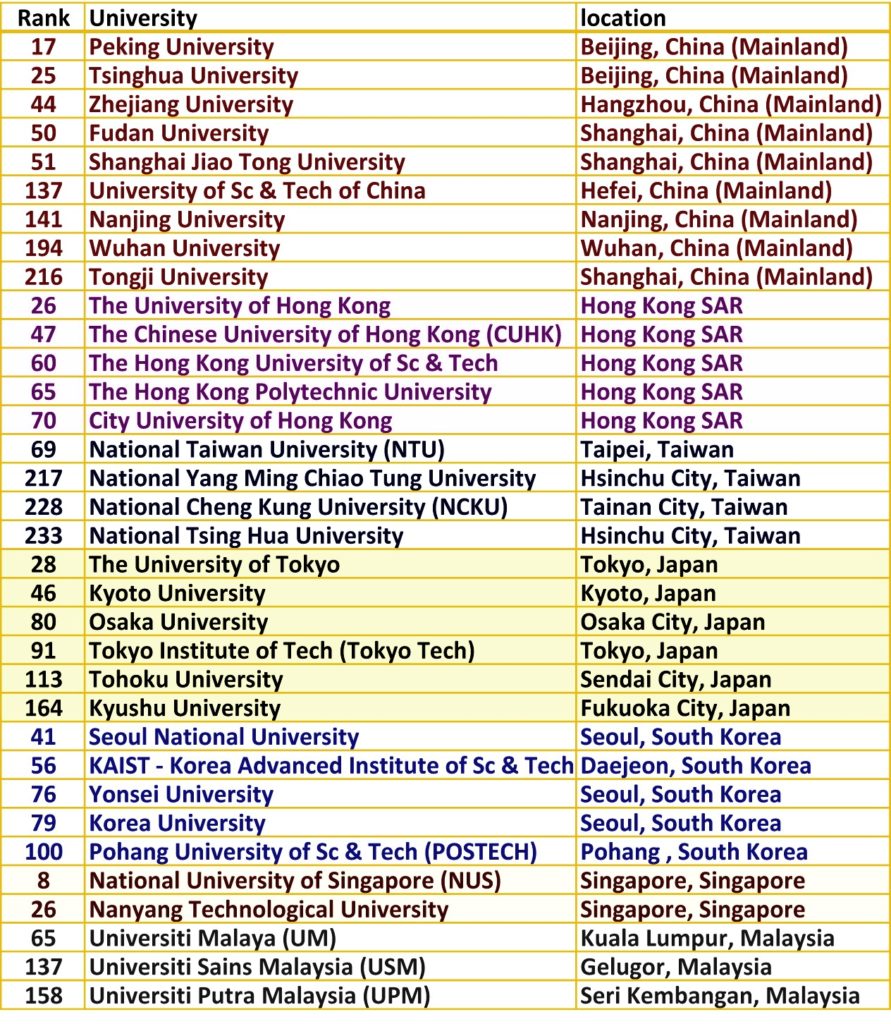
*QS 2024 Top Universities in Asia
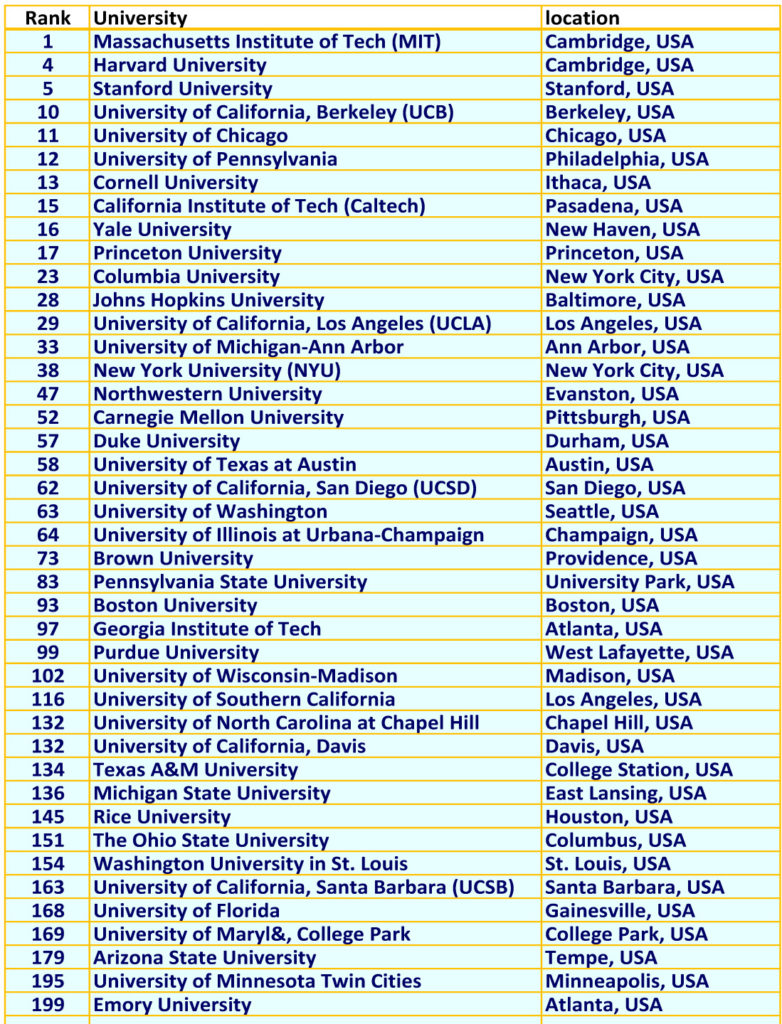
*QS 2024 Top Universities in USA
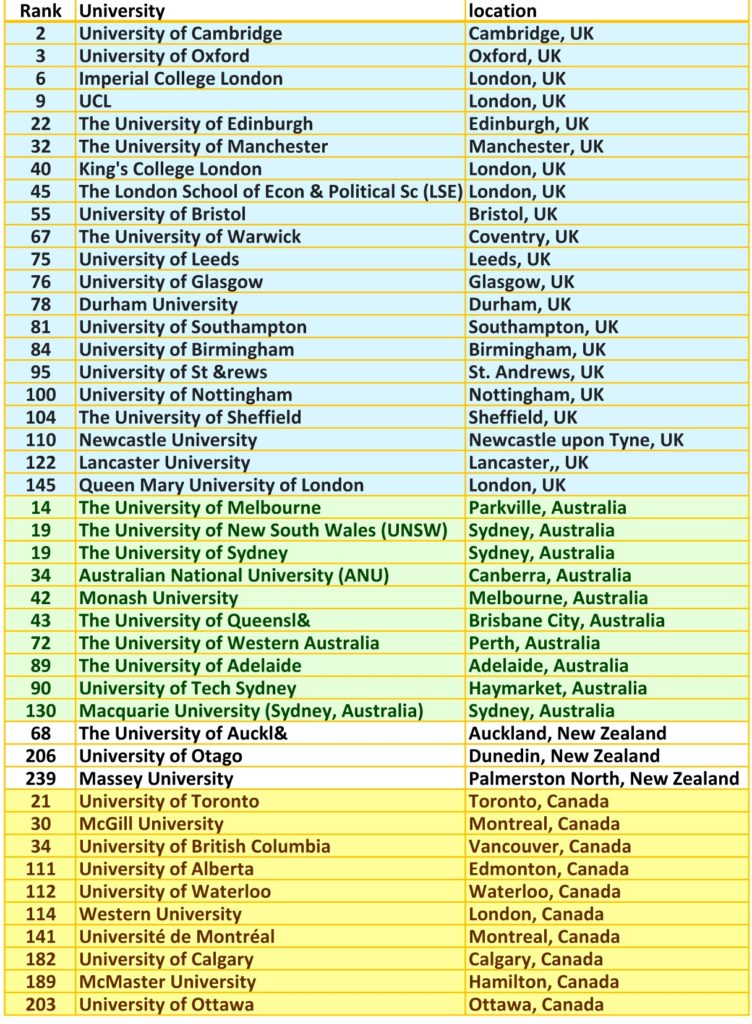
*QS 2024 Top Universities in UK, Canada and Australia:
2024 QS Top Universties in UK, Canada and Australia*QS 2024 Top Universities in Asia
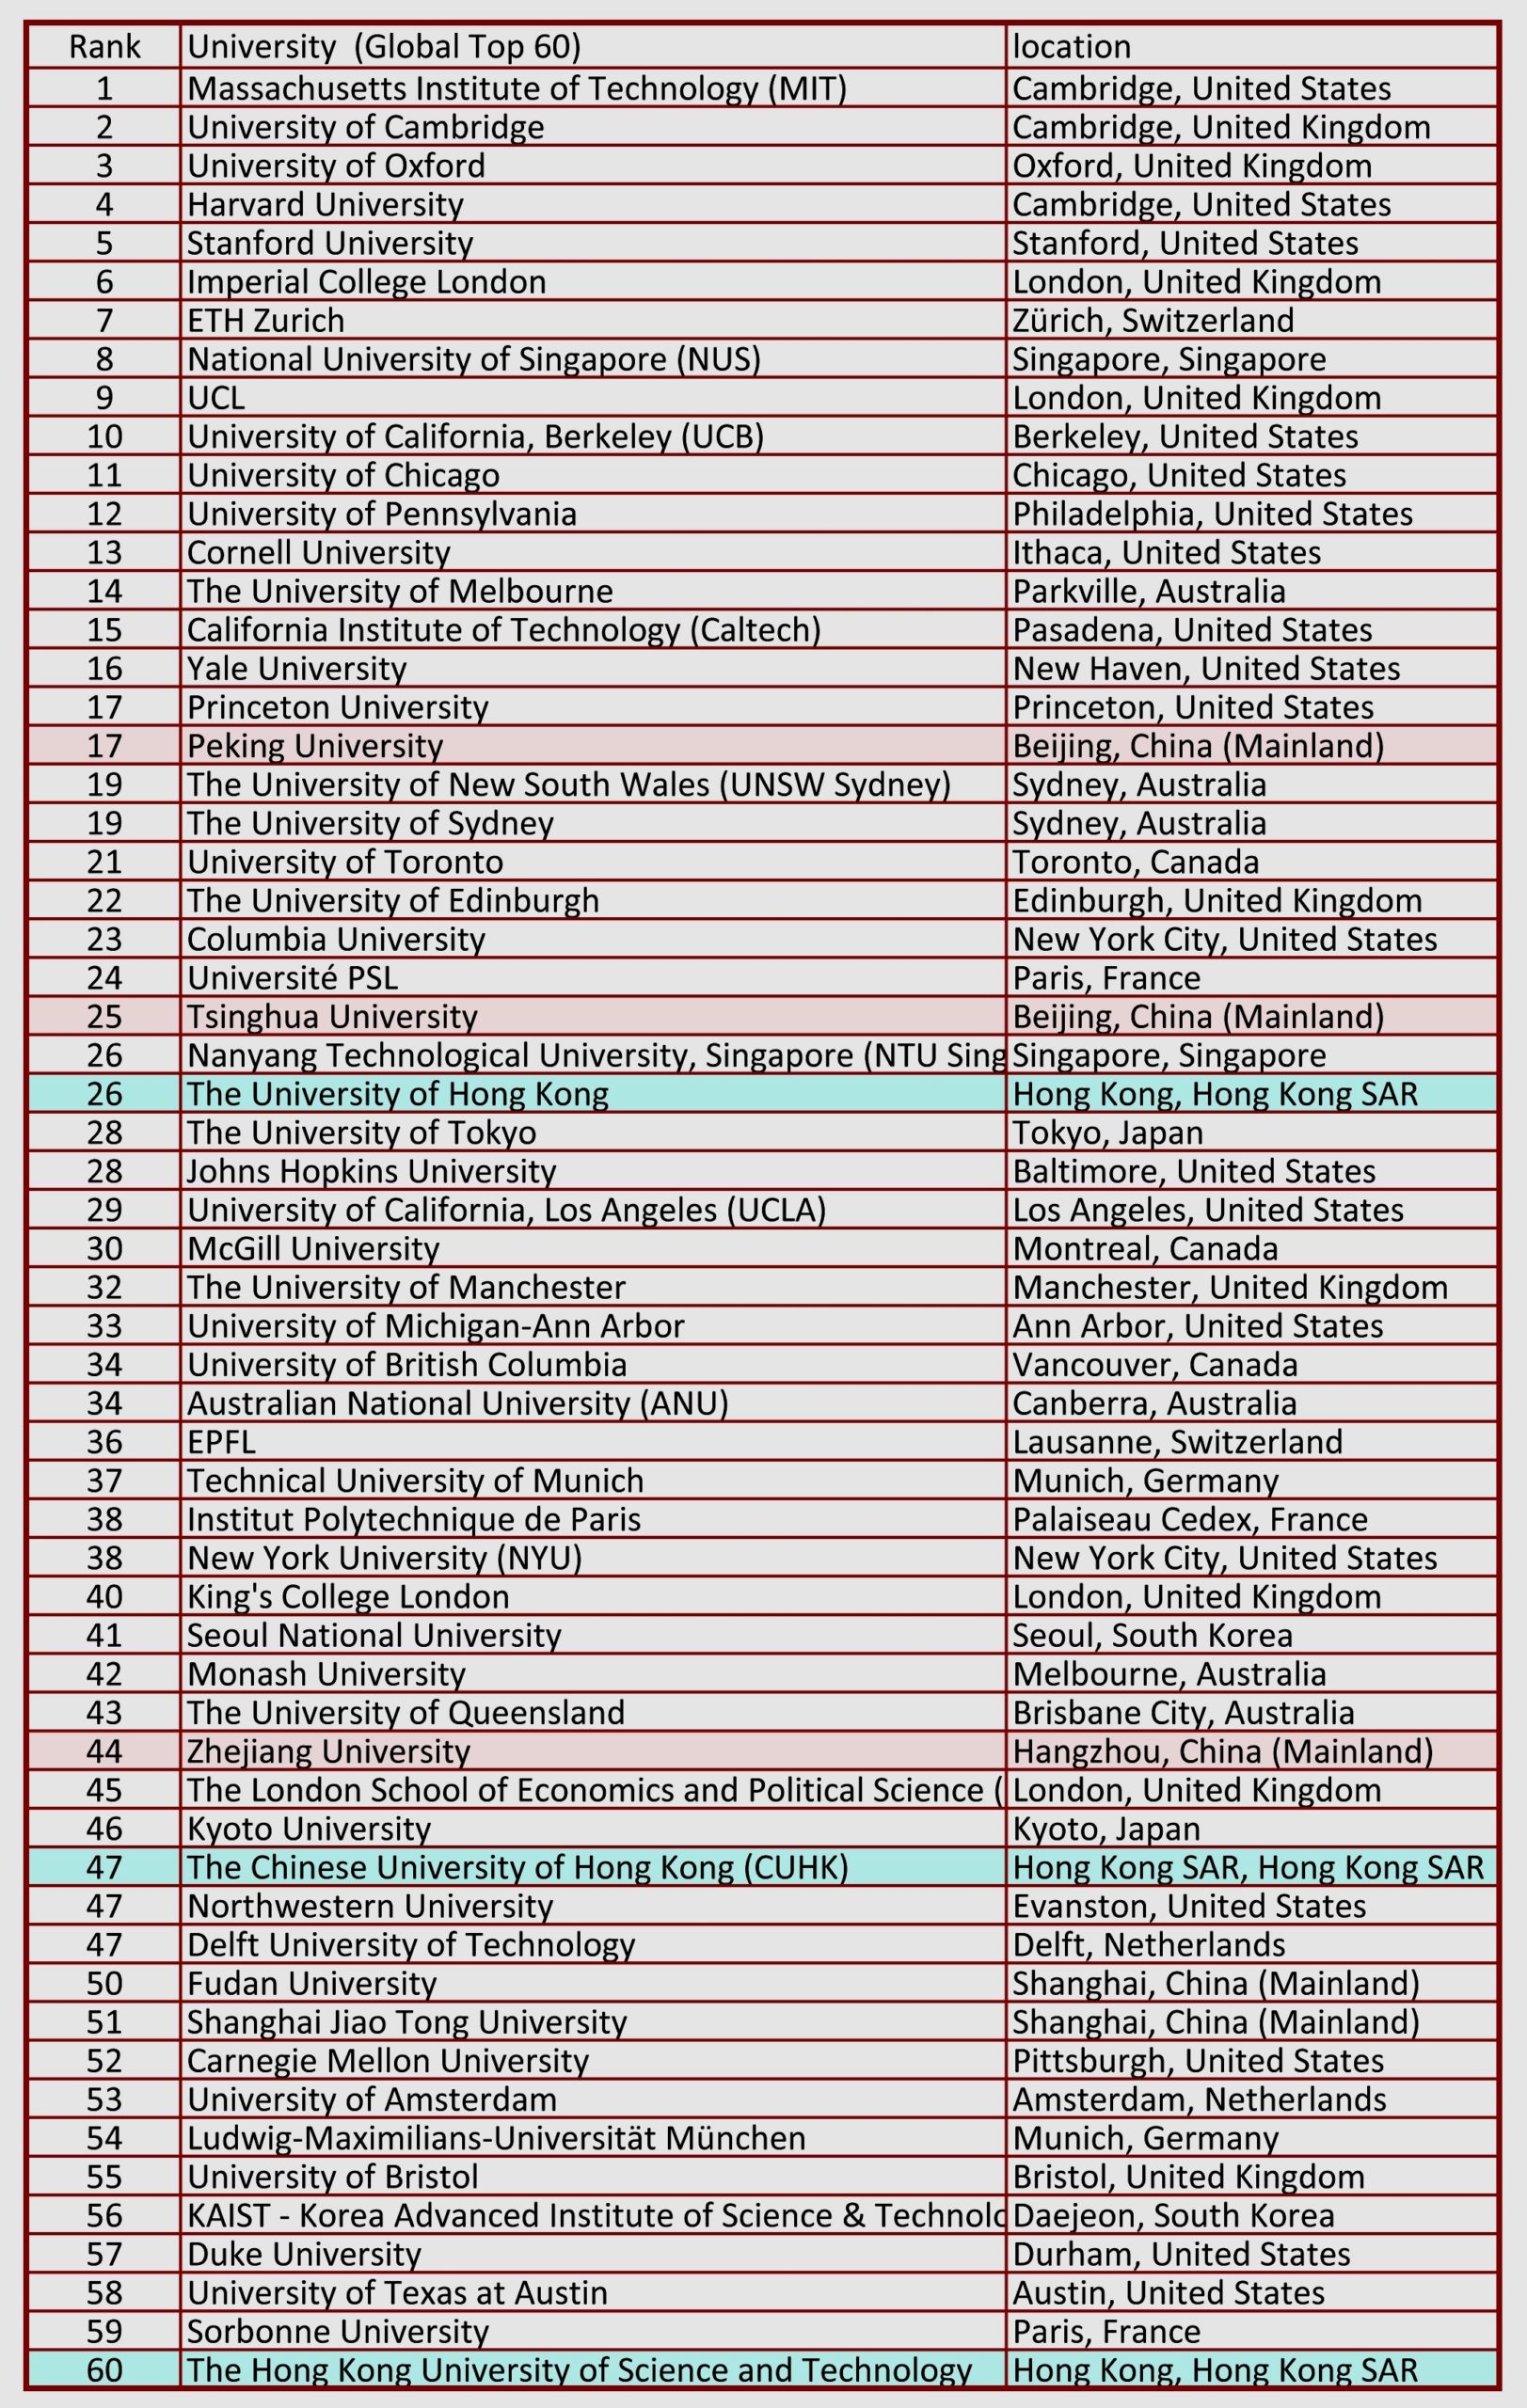
QS World University Ranking 2024 – Top 60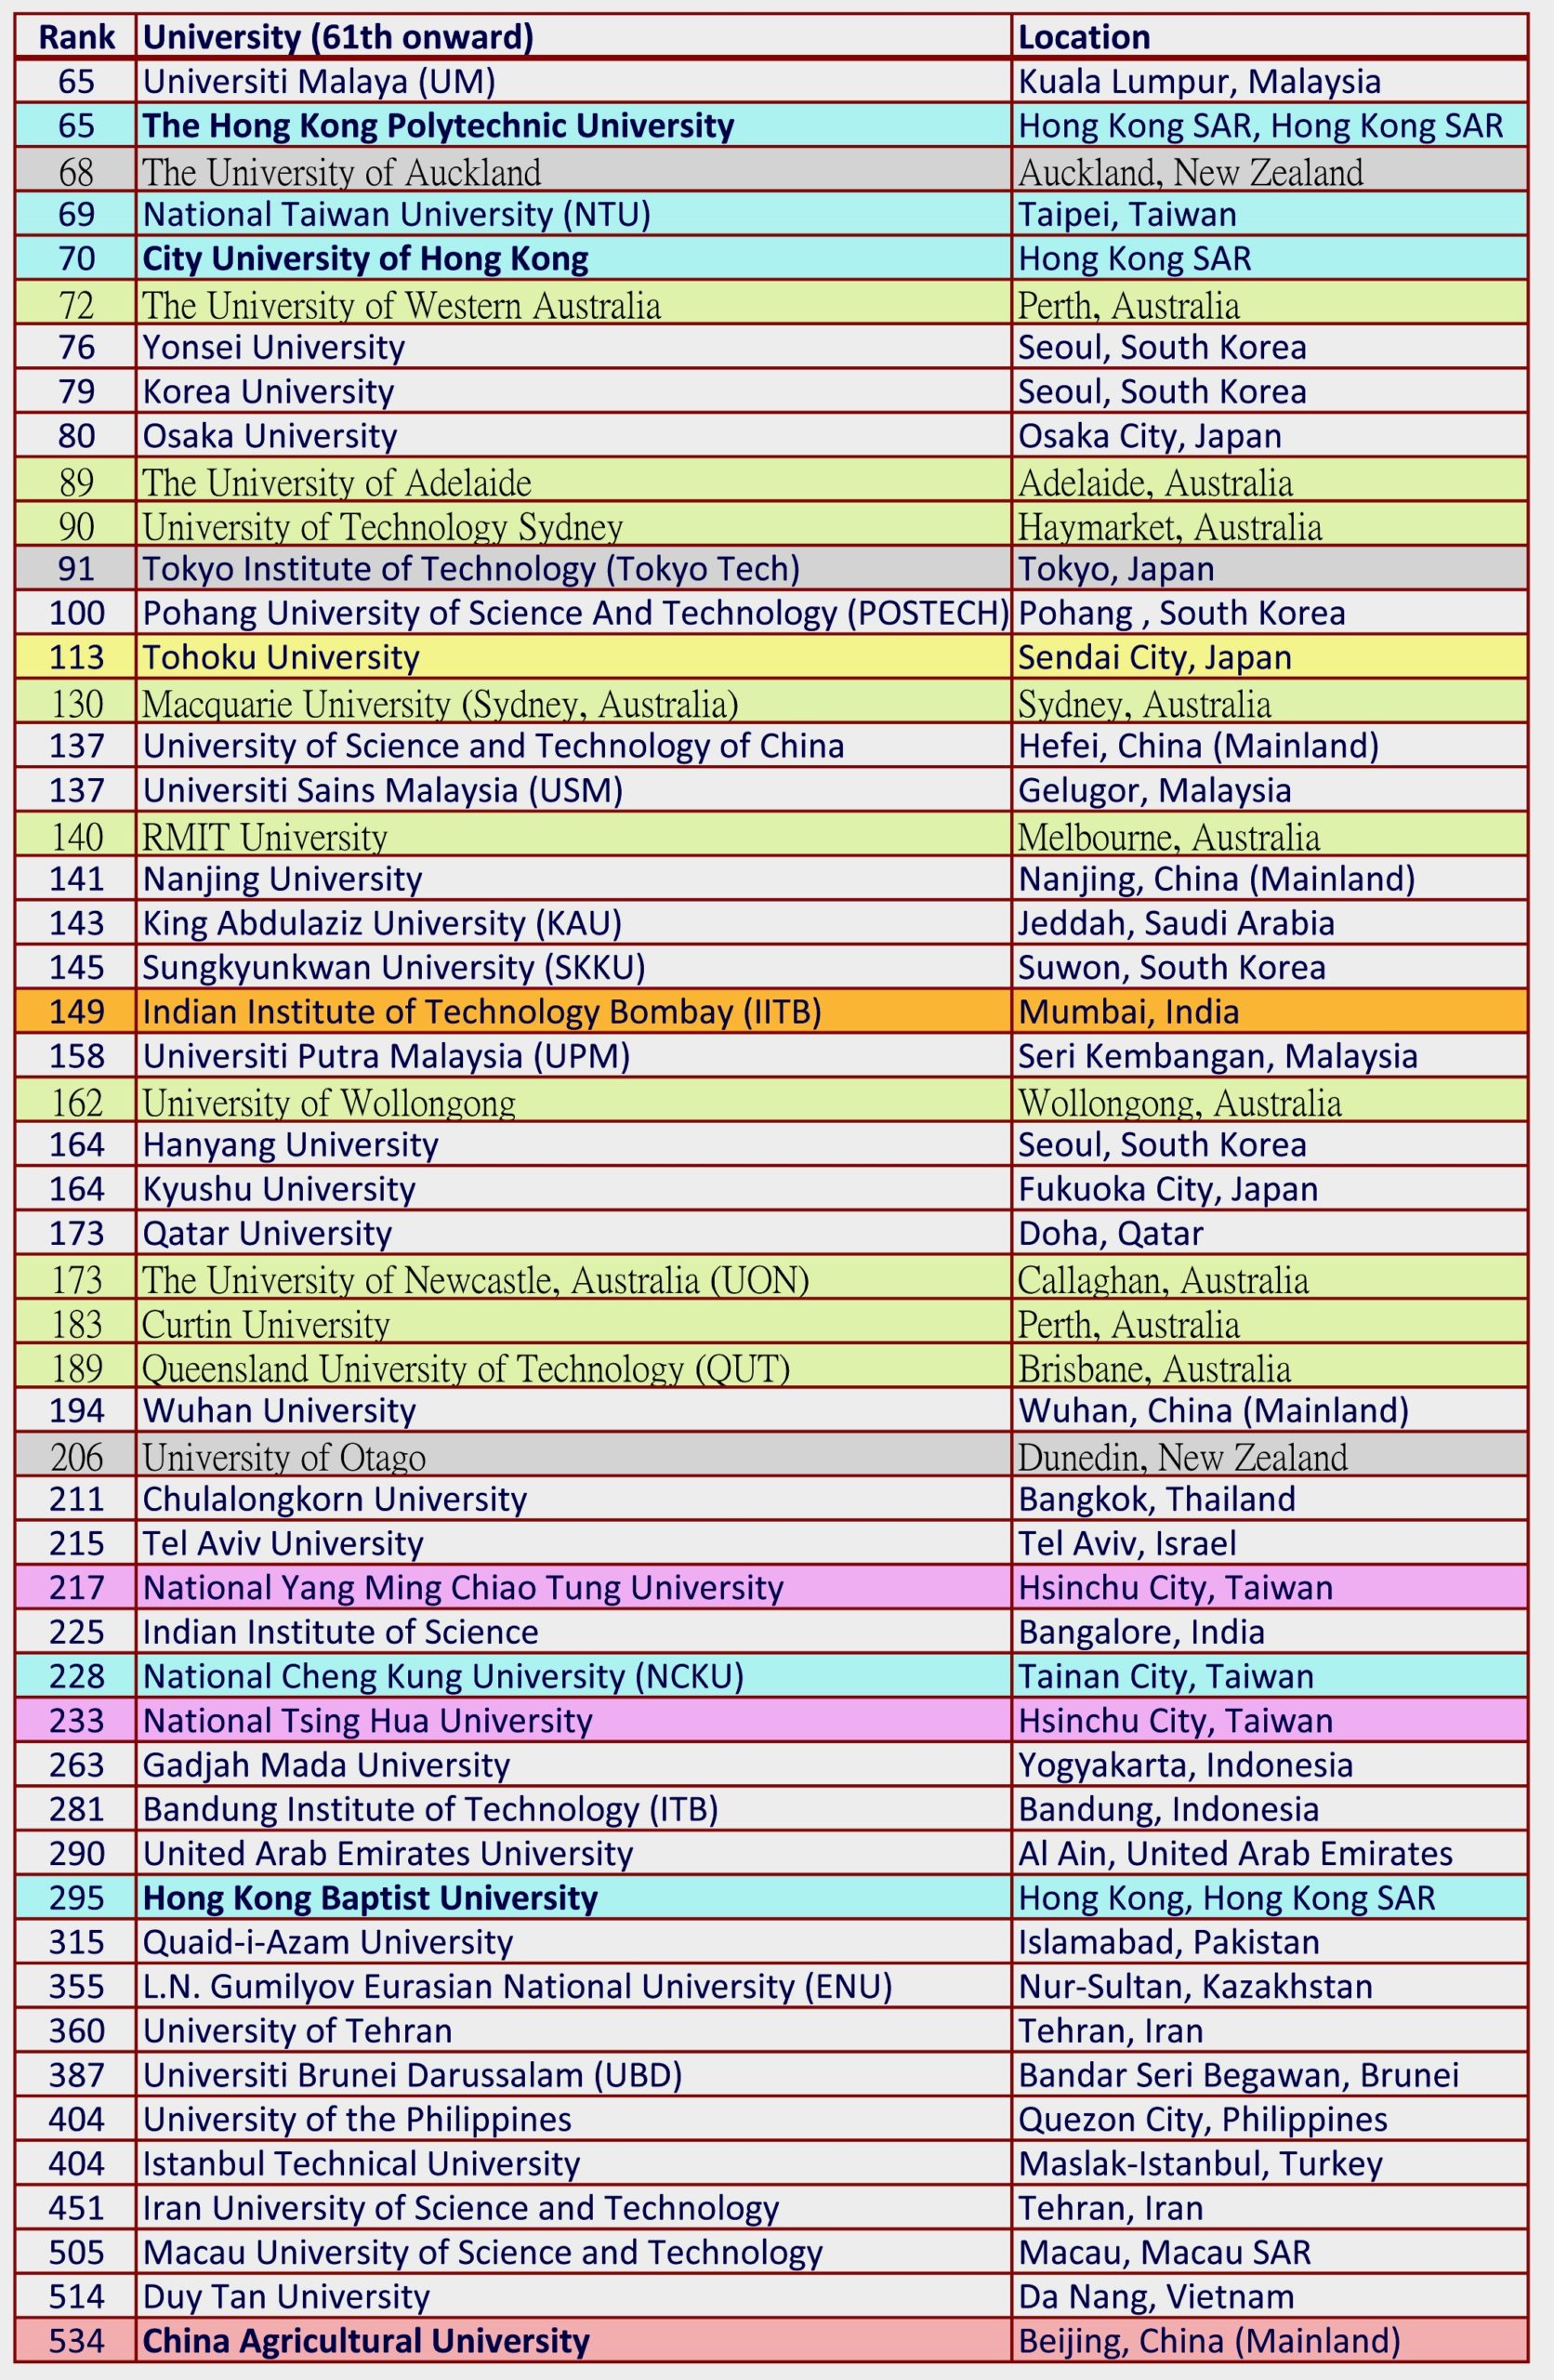
QS University Ranking – 61th onward (selected countries)Source: https://www.qs.com/rankings-released-qs-world-university-rankings-2024/
| Rank | University | Location |
| 1 | Massachusetts Institute of Technology (MIT) | Cambridge, United States |
| 2 | University of Cambridge | Cambridge, United Kingdom |
| 3 | University of Oxford | Oxford, United Kingdom |
| 4 | Harvard University | Cambridge, United States |
| 5 | Stanford University | Stanford, United States |
| 6 | Imperial College London | London, United Kingdom |
| 7 | ETH Zurich | Zürich, Switzerland |
| 8 | National University of Singapore (NUS) | Singapore, Singapore |
| 9 | UCL | London, United Kingdom |
| 10 | University of California, Berkeley (UCB) | Berkeley, United States |
| 11 | University of Chicago | Chicago, United States |
| 12 | University of Pennsylvania | Philadelphia, United States |
| 13 | Cornell University | Ithaca, United States |
| 14 | The University of Melbourne | Parkville, Australia |
| 15 | California Institute of Technology (Caltech) | Pasadena, United States |
| 16 | Yale University | New Haven, United States |
| 17 | Princeton University | Princeton, United States |
| 17 | Peking University | Beijing, China (Mainland) |
| 19 | The University of New South Wales (UNSW Sydney) | Sydney, Australia |
| 19 | The University of Sydney | Sydney, Australia |
| 21 | University of Toronto | Toronto, Canada |
| 22 | The University of Edinburgh | Edinburgh, United Kingdom |
| 23 | Columbia University | New York City, United States |
| 24 | Université PSL | Paris, France |
| 25 | Tsinghua University | Beijing, China (Mainland) |
| 26 | Nanyang Technological University, Singapore (NTU Singapore) | Singapore, Singapore |
| 26 | The University of Hong Kong | Hong Kong, Hong Kong SAR |
| 28 | The University of Tokyo | Tokyo, Japan |
| 29 | University of California, Los Angeles (UCLA) | Los Angeles, United States |
| 30 | McGill University | Montreal, Canada |
| 32 | The University of Manchester | Manchester, United Kingdom |
| 33 | University of Michigan-Ann Arbor | Ann Arbor, United States |
| 34 | University of British Columbia | Vancouver, Canada |
| 34 | Australian National University (ANU) | Canberra, Australia |
| 36 | EPFL | Lausanne, Switzerland |
| 37 | Technical University of Munich | Munich, Germany |
| 38 | Institut Polytechnique de Paris | Palaiseau Cedex, France |
| 38 | New York University (NYU) | New York City, United States |
| 40 | King’s College London | London, United Kingdom |
| 41 | Seoul National University | Seoul, South Korea |
| 42 | Monash University | Melbourne, Australia |
| 43 | The University of Queensland | Brisbane City, Australia |
| 44 | Zhejiang University | Hangzhou, China (Mainland) |
| 46 | Kyoto University | Kyoto, Japan |
| 47 | The Chinese University of Hong Kong (CUHK) | Hong Kong, Hong Kong SAR |
| 47 | Northwestern University | Evanston, United States |
| 47 | Delft University of Technology | Delft, Netherlands |
| 50 | Fudan University | Shanghai, China (Mainland) |
| 51 | Shanghai Jiao Tong University | Shanghai, China (Mainland) |
| 52 | Carnegie Mellon University | Pittsburgh, United States |
| 53 | University of Amsterdam | Amsterdam, Netherlands |
| 54 | Ludwig-Maximilians-Universität München | Munich, Germany |
| 55 | University of Bristol | Bristol, United Kingdom |
| 56 | KAIST – Korea Advanced Institute of Science & Technology | Daejeon, South Korea |
| 57 | Duke University | Durham, United States |
| 58 | University of Texas at Austin | Austin, United States |
| 59 | Sorbonne University | Paris, France |
| 60 | The Hong Kong University of Science and Technology | Hong Kong, Hong Kong SAR |
| 61 | KU Leuven | Leuven, Belgium |
| 62 | University of California, San Diego (UCSD) | San Diego, United States |
| 63 | University of Washington | Seattle, United States |
| 64 | University of Illinois at Urbana-Champaign | Champaign, United States |
| 65 | Universiti Malaya (UM) | Kuala Lumpur, Malaysia |
| 65 | The Hong Kong Polytechnic University | Hong Kong SAR, Hong Kong SAR |
| 67 | The University of Warwick | Coventry, United Kingdom |
| 68 | The University of Auckland | Auckland, New Zealand |
| 69 | National Taiwan University (NTU) | Taipei, Taiwan |
| 71 | Université Paris-Saclay | Gif-sur-Yvette,, France |
| 72 | The University of Western Australia | Perth, Australia |
| 73 | KTH Royal Institute of Technology | Stockholm, Sweden |
| 73 | Brown University | Providence, United States |
| 75 | University of Leeds | Leeds, United Kingdom |
| 76 | Yonsei University | Seoul, South Korea |
| 76 | University of Glasgow | Glasgow, United Kingdom |
| 78 | Durham University | Durham, United Kingdom |
| 79 | Korea University | Seoul, South Korea |
| 80 | Osaka University | Osaka City, Japan |
| 81 | University of Southampton | Southampton, United Kingdom |
| 81 | Trinity College Dublin, The University of Dublin | Dublin, Ireland |
| 83 | Pennsylvania State University | University Park, United States |
| 84 | University of Birmingham | Birmingham, United Kingdom |
| 85 | Universidade de São Paulo | São Paulo, Brazil |
| 85 | Lund University | Lund, Sweden |
| 87 | Lomonosov Moscow State University | Moscow, Russia |
| 87 | Universität Heidelberg | Heidelberg, Germany |
| 89 | The University of Adelaide | Adelaide, Australia |
| 90 | University of Technology Sydney | Haymarket, Australia |
| 91 | University of Zurich | Zürich, Switzerland |
| 91 | Tokyo Institute of Technology (Tokyo Tech) | Tokyo, Japan |
| 93 | Universidad Nacional Autónoma de México (UNAM) | Mexico City, Mexico |
| 93 | Boston University | Boston, United States |
| 95 | University of St Andrews | St. Andrews, United Kingdom |
| 95 | Universidad de Buenos Aires (UBA) | Buenos Aires, Argentina |
| 97 | Georgia Institute of Technology | Atlanta, United States |
| 98 | Freie Universitaet Berlin | Berlin, Germany |
| 99 | Purdue University | West Lafayette, United States |
| 100 | Pohang University of Science And Technology (POSTECH) | Pohang , South Korea |
| 100 | University of Nottingham | Nottingham, United Kingdom |
| 102 | University of Wisconsin-Madison | Madison, United States |
| 103 | Pontificia Universidad Católica de Chile (UC) | Santiago, Chile |
| 104 | The University of Sheffield | Sheffield, United Kingdom |
| 105 | Uppsala University | Uppsala, Sweden |
| 106 | RWTH Aachen University | Aachen, Germany |
| 107 | Utrecht University | Utrecht, Netherlands |
| 107 | University of Copenhagen | Copenhagen, Denmark |
| 109 | Aalto University | Espoo, Finland |
| 110 | Newcastle University | Newcastle upon Tyne, United Kingdom |
| 111 | University of Alberta | Edmonton, Canada |
| 112 | University of Waterloo | Waterloo, Canada |
| 113 | Tohoku University | Sendai City, Japan |
| 114 | Western University | London, Canada |
| 115 | University of Helsinki | Helsinki, Finland |
| 116 | University of Southern California | Los Angeles, United States |
| 117 | University of Oslo | Oslo, Norway |
| 118 | Stockholm University | Stockholm, Sweden |
| 119 | KIT, Karlsruhe Institute of Technology | Karlsruhe, Germany |
| 120 | Humboldt-Universität zu Berlin | Berlin, Germany |
| 121 | Technical University of Denmark | Kongens Lyngby, Denmark |
| 122 | Lancaster University | Lancaster,, United Kingdom |
| 123 | Politecnico di Milano | Milan, Italy |
| 124 | Eindhoven University of Technology | Eindhoven, Netherlands |
| 124 | University of Basel | Basel, Switzerland |
| 126 | Leiden University | Leiden, Netherlands |
| 126 | University of Bern | Bern, Switzerland |
| 128 | University of Geneva | Geneva, Switzerland |
| 129 | Chalmers University of Technology | Gothenburg, Sweden |
| 130 | University of Vienna | Vienna, Austria |
| 130 | Macquarie University (Sydney, Australia) | Sydney, Australia |
| 132 | University of North Carolina at Chapel Hill | Chapel Hill, United States |
| 134 | Sapienza University of Rome | Rome, Italy |
| 134 | Texas A&M University | College Station, United States |
| 136 | Michigan State University | East Lansing, United States |
| 137 | University of Science and Technology of China | Hefei, China (Mainland) |
| 137 | Universiti Sains Malaysia (USM) | Gelugor, Malaysia |
| 139 | University of Groningen | Groningen, Netherlands |
| 140 | RMIT University | Melbourne, Australia |
| 141 | Nanjing University | Nanjing, China (Mainland) |
| 141 | Université de Montréal | Montreal, Canada |
| 143 | King Abdulaziz University (KAU) | Jeddah, Saudi Arabia |
| 143 | Aarhus University | Aarhus, Denmark |
| 145 | Sungkyunkwan University (SKKU) | Suwon, South Korea |
| 145 | Queen Mary University of London | London, United Kingdom |
| 145 | Rice University | Houston, United States |
| 148 | University of Bath | Bath, United Kingdom |
| 149 | Indian Institute of Technology Bombay (IITB) | Mumbai, India |
| 149 | Universitat Autònoma de Barcelona | Barcelona, Spain |
| 151 | Wageningen University & Research | Wageningen, Netherlands |
| 151 | The Ohio State University | Columbus, United States |
| 153 | University of Exeter | Exeter, United Kingdom |
| 154 | Washington University in St. Louis | St. Louis, United States |
| 154 | Cardiff University | Cardiff, United Kingdom |
| 154 | Alma Mater Studiorum – University of Bologna | Bologna, Italy |
| 154 | Technische Universität Berlin (TU Berlin) | Berlin, Germany |
| 158 | Universiti Putra Malaysia (UPM) | Seri Kembangan, Malaysia |
| 159 | Universidad de Chile | Santiago, Chile |
| 159 | Ghent University | Ghent, Belgium |
| 159 | Universiti Kebangsaan Malaysia (UKM) | Bangi, Malaysia |
| 162 | University of Wollongong | Wollongong, Australia |
| 163 | University of California, Santa Barbara (UCSB) | Santa Barbara, United States |
| 164 | Hanyang University | Seoul, South Korea |
| 164 | Kyushu University | Fukuoka City, Japan |
| 164 | Universitat de Barcelona | Barcelona, Spain |
| 167 | University of York | York, United Kingdom |
| 168 | University of Florida | Gainesville, United States |
| 169 | University of Reading | Reading, United Kingdom |
| 169 | University of Maryland, College Park | College Park, United States |
| 171 | Complutense University of Madrid | Madrid, Spain |
| 171 | University College Dublin | Dublin, Ireland |
| 173 | Qatar University | Doha, Qatar |
| 173 | University of Cape Town | Cape Town, South Africa |
| 173 | The University of Newcastle, Australia (UON) | Callaghan, Australia |
| 176 | Erasmus University Rotterdam | Rotterdam, Netherlands |
| 176 | Nagoya University | Nagoya, Japan |
| 176 | University of Liverpool | Liverpool, United Kingdom |
| 179 | Arizona State University | Tempe, United States |
| 180 | Université catholique de Louvain (UCLouvain) | Louvain-la-Neuve, Belgium |
| 180 | King Fahd University of Petroleum & Minerals | Dhahran, Saudi Arabia |
| 182 | University of Calgary | Calgary, Canada |
| 183 | Curtin University | Perth, Australia |
| 184 | Technische Universität Wien | Vienna, Austria |
| 184 | Tecnológico de Monterrey | Monterrey, Mexico |
| 184 | École Normale Supérieure de Lyon | Lyon, France |
| 187 | University of Gothenburg | Gothenburg, Sweden |
| 188 | Universiti Teknologi Malaysia | Skudai, Malaysia |
| 189 | McMaster University | Hamilton, Canada |
| 189 | Universite libre de Bruxelles | Brussels, Belgium |
| 189 | Queensland University of Technology (QUT) | Brisbane, Australia |
| 192 | Ecole des Ponts ParisTech | Paris, France |
| 192 | Albert-Ludwigs-Universitaet Freiburg | Freiburg im Breisgau, Germany |
| 194 | Wuhan University | Wuhan, China (Mainland) |
| 195 | University of Minnesota Twin Cities | Minneapolis, United States |
| 196 | Hokkaido University | Sapporo, Japan |
| 197 | Indian Institute of Technology Delhi (IITD) | New Delhi, India |
| 198 | Universidad de los Andes | Bogotá, Colombia |
| 199 | Waseda University | Tokyo, Japan |
| 199 | Universidad Autónoma de Madrid | Madrid, Spain |
| 202 | Queen’s University Belfast | Belfast, United Kingdom |
| 203 | King Saud University | Riyadh, Saudi Arabia |
| 203 | University of Ottawa | Ottawa, Canada |
| 205 | Universität Hamburg | Hamburg, Germany |
| 206 | University of Otago | Dunedin, New Zealand |
| 207 | Vrije Universiteit Amsterdam | Amsterdam, Netherlands |
| 208 | University of Aberdeen | Aberdeen, United Kingdom |
| 209 | Queen’s University at Kingston | Kingston, Canada |
| 210 | University of Twente | Enschede, Netherlands |
| 211 | Chulalongkorn University | Bangkok, Thailand |
| 212 | Loughborough University | Loughborough, United Kingdom |
| 213 | Eberhard Karls Universität Tübingen | Tübingen, Germany |
| 214 | Keio University | Tokyo, Japan |
| 215 | Tel Aviv University | Tel Aviv, Israel |
| 216 | Tongji University | Shanghai, China (Mainland) |
| 217 | National Yang Ming Chiao Tung University | Hsinchu City, Taiwan |
| 218 | University of Sussex | Brighton, United Kingdom |
| 219 | Università di Padova | Padova, Italy |
| 220 | University of Lausanne | Lausanne, Switzerland |
| 220 | Universidade Estadual de Campinas (Unicamp) | Campinas, Brazil |
| 222 | University of Pittsburgh | Pittsburgh, United States |
| 222 | Radboud University | Nijmegen, Netherlands |
| 224 | University of Rochester | Rochester, United States |
| 225 | Indian Institute of Science | Bangalore, India |
| 226 | Universidad Nacional de Colombia | Bogotá, Colombia |
| 226 | American University of Beirut (AUB) | Beirut , Lebanon |
| 228 | National Cheng Kung University (NCKU) | Tainan City, Taiwan |
| 229 | Friedrich-Alexander-Universität Erlangen-Nürnberg | Erlangen, Germany |
| 230 | Al-Farabi Kazakh National University | Almaty, Kazakhstan |
| 230 | Khalifa University | Abu Dhabi, United Arab Emirates |
| 232 | University of Göttingen | Göttingen, Germany |
| 233 | National Tsing Hua University | Hsinchu City, Taiwan |
| 233 | Deakin University. | Burwood, Australia |
| 235 | Heriot-Watt University | Edinburgh, United Kingdom |
| 236 | Université Paris Cité | Paris, France |
| 237 | Dartmouth College | Hanover, United States |
| 237 | Universitas Indonesia | Depok, Indonesia |
| 239 | Massey University | Palmerston North, New Zealand |
| 239 | Rheinische Friedrich-Wilhelms-Universität Bonn | Bonn, Germany |
| 241 | Victoria University of Wellington | Kelburn, Wellington, New Zealand |
| 242 | La Trobe University | Melbourne, Australia |
| 243 | Griffith University | Nathan, Australia |
| 244 | University of Surrey | Guildford, United Kingdom |
| 245 | University of Massachusetts Amherst | Amherst, United States |
| 246 | Technische Universität Dresden | Dresden, Germany |
| 246 | Technical University of Darmstadt | Darmstadt, Germany |
| 248 | Charles University | Prague, Czechia |
| 248 | University of Antwerp | Antwerp, Belgium |
| 250 | University of Waikato | Hamilton , New Zealand |
| 251 | The Hebrew University of Jerusalem | Jerusalem, Israel |
| 252 | Politecnico di Torino | Turin, Italy |
| 253 | University of Porto | Porto, Portugal |
| 254 | University of Macau | null Macau SAR |
| 255 | Case Western Reserve University | Cleveland, United States |
| 256 | Maastricht University | Maastricht, Netherlands |
| 256 | Harbin Institute of Technology | Harbin, China (Mainland) |
| 256 | University of Canterbury | Te Whare Wānanga o Waitaha | Christchurch, New Zealand |
| 259 | Vrije Universiteit Brussel (VUB) | Brussels, Belgium |
| 260 | University of Virginia | Charlottesville, United States |
| 261 | Vanderbilt University | Nashville, United States |
| 262 | University of Warsaw | Warsaw, Poland |
| 263 | Gadjah Mada University | Yogyakarta, Indonesia |
| 264 | University of Witwatersrand | Johannesburg, South Africa |
| 264 | University of Colorado Boulder | Boulder, United States |
| 266 | Ulsan National Institute of Science and Technology (UNIST) | Ulsan, South Korea |
| 266 | University of Lisbon | Lisbon, Portugal |
| 268 | Linköping University | Linköping, Sweden |
| 268 | University of California, Irvine | Irvine, United States |
| 268 | University of Cologne | Cologne, Germany |
| 271 | Indian Institute of Technology Kharagpur (IIT-KGP) | Kharagpur, India |
| 272 | University of Leicester | Leicester, United Kingdom |
| 272 | Beijing Normal University | Beijing, China (Mainland) |
| 274 | North Carolina State University | Raleigh, United States |
| 275 | Huazhong University of Science and Technology | Wuhan, China (Mainland) |
| 276 | University of Milan | Milan, Italy |
| 276 | University of Strathclyde | Glasgow, United Kingdom |
| 278 | University of Miami | Miami, United States |
| 278 | Indian Institute of Technology Kanpur (IITK) | Kanpur, India |
| 280 | University of Navarra | Pamplona, Spain |
| 281 | University of Bergen | Bergen, Norway |
| 281 | Bandung Institute of Technology (ITB) | Bandung, Indonesia |
| 283 | Stellenbosch University | Stellenbosch, South Africa |
| 284 | Taylor’s University | Subang Jaya, Malaysia |
| 285 | The University of Arizona | Tucson, United States |
| 285 | Tianjin University | Tianjin, China (Mainland) |
| 285 | Swinburne University of Technology | Melbourne, Australia |
| 285 | Indian Institute of Technology Madras (IITM) | Chennai, India |
| 289 | University of Galway | Galway, Ireland |
| 290 | United Arab Emirates University | Al Ain, United Arab Emirates |
| 291 | Xi’an Jiaotong University | Xi’an, China (Mainland) |
| 292 | Norwegian University of Science And Technology | Trondheim, Norway |
| 292 | University College Cork | Cork, Ireland |
| 294 | Université Grenoble Alpes | Grenoble, France |
| 295 | University of East Anglia (UEA) | Norwich, United Kingdom |
| 295 | Hong Kong Baptist University | Hong Kong, Hong Kong SAR |
| 297 | Georgetown University | Washington D.C., United States |
| 298 | Dalhousie University | Halifax, Canada |
| 299 | Rutgers University–New Brunswick | New Brunswick, United States |
| 300 | UCSI University | Kuala Lumpur, Malaysia |
| 301 | Southern University of Science and Technology (SUSTech) | Shenzhen, China (Mainland) |
| 302 | Goethe-University Frankfurt am Main | Frankfurt, Germany |
| 302 | Virginia Polytechnic Institute and State University | Blacksburg, United States |
| 304 | University of Notre Dame | Notre Dame, United States |
| 304 | Jagiellonian University | Krakow, Poland |
| 306 | University of Johannesburg | Johannesburg, South Africa |
| 307 | Swansea University | Swansea, United Kingdom |
| 307 | Universiti Teknologi PETRONAS (UTP) | Seri Iskandar, Malaysia |
| 307 | University of Tasmania | Hobart, Australia |
| 310 | Hamad bin Khalifa University | Doha, Qatar |
| 310 | Universitat Pompeu Fabra (Barcelona) | Barcelona, Spain |
| 312 | Universität Stuttgart | Stuttgart, Germany |
| 313 | University of Oulu | Oulu, Finland |
| 313 | Indiana University Bloomington | Bloomington, United States |
| 315 | University of Turku | Turku, Finland |
| 315 | Saint Petersburg State University | Saint Petersburg, Russia |
| 315 | Quaid-i-Azam University | Islamabad, Pakistan |
| 318 | Simon Fraser University | Burnaby, Canada |
| 319 | Sciences Po | Paris, France |
| 319 | Bauman Moscow State Technical University | Moscow, Russia |
| 319 | Universidad Carlos III de Madrid (UC3M) | Madrid, Spain |
| 322 | University of Victoria (UVic) | Victoria, Canada |
| 323 | University of Pretoria | Pretoria, South Africa |
| 323 | Sun Yat-sen University | Guangzhou, China (Mainland) |
| 323 | University of Illinois at Chicago (UIC) | Chicago, United States |
| 326 | University of Southern Denmark (SDU) | Odense, Denmark |
| 326 | University of South Australia | Adelaide, Australia |
| 328 | Université Paris 1 Panthéon-Sorbonne | Paris, France |
| 328 | USI – Università della Svizzera italiana | Lugano, Switzerland |
| 328 | City, University of London | London, United Kingdom |
| 328 | Gwangju Institute of Science and Technology (GIST) | Gwangju, South Korea |
| 332 | Kyung Hee University | Seoul, South Korea |
| 332 | University of California, Santa Cruz | Santa Cruz, United States |
| 334 | Sharif University of Technology | Tehran, Iran |
| 335 | University of Naples – Federico II | Naples, Italy |
| 336 | Pontificia Universidad Catolica del Peru | Lima, Peru |
| 336 | University of Kent | Canterbury, United Kingdom |
| 336 | Middle East Technical University | Ankara, Turkey |
| 336 | Aalborg University | Aalborg, Denmark |
| 340 | George Washington University | Washington D.C., United States |
| 340 | Beijing Institute of Technology | Beijing, China (Mainland) |
| 342 | RUDN University | Moscow, Russia |
| 343 | Brunel University London | London, United Kingdom |
| 344 | University of Aveiro | Aveiro, Portugal |
| 345 | Airlangga University | Surabaya, Indonesia |
| 345 | University of Saskatchewan | Saskatoon, Canada |
| 347 | Pontificia Universidad Javeriana | Bogotá, Colombia |
| 347 | National Technical University of Athens | Athens, Greece |
| 349 | University of Pisa | Pisa, Italy |
| 349 | Universidad Politécnica de Madrid (UPM) | Madrid, Spain |
| 351 | Lappeenranta-Lahti University of Technology LUT | Lappeenranta, Finland |
| 351 | University of Coimbra | Coimbra, Portugal |
| 353 | York University | Toronto, Canada |
| 354 | Universitat Politècnica de Catalunya · BarcelonaTech (UPC) | Barcelona, Spain |
| 355 | University of Tsukuba | Tsukuba City, Japan |
| 355 | L.N. Gumilyov Eurasian National University (ENU) | Nur-Sultan, Kazakhstan |
| 355 | Sichuan University | Chengdu, China (Mainland) |
| 358 | University of Tartu | Tartu, Estonia |
| 358 | University of Florence | Florence, Italy |
| 360 | University of Tehran | Tehran, Iran |
| 360 | Shandong University | Jinan, China (Mainland) |
| 362 | Lincoln University | Lincoln, New Zealand |
| 362 | Universität Innsbruck | Innsbruck, Austria |
| 364 | University of Turin | Turin, Italy |
| 364 | American University of Sharjah | Sharjah, United Arab Emirates |
| 364 | Indian Institute of Technology Guwahati (IITG) | Guwahati, India |
| 367 | National University of Sciences And Technology (NUST) Islamabad | Islamabad, Pakistan |
| 368 | University of Cyprus (UCY) | Nicosia, Cyprus |
| 369 | Indian Institute of Technology Roorkee (IITR) | Roorkee, India |
| 369 | Yeshiva University | New York City, United States |
| 371 | Tilburg University | Tilburg, Netherlands |
| 371 | Universidade Federal do Rio de Janeiro | Rio de Janeiro, Brazil |
| 371 | Cairo University | Giza, Egypt |
| 374 | Birkbeck, University of London | London, United Kingdom |
| 375 | Amirkabir University of Technology | Tehran, Iran |
| 375 | Western Sydney University | Milperra, Australia |
| 375 | Northeastern University | Boston, United States |
| 375 | Ruhr-Universität Bochum | Bochum, Germany |
| 379 | Tufts University | Medford, United States |
| 380 | Flinders University | Adelaide, Australia |
| 381 | University of Luxembourg | Luxembourg, Luxembourg |
| 382 | Mahidol University | Nakhon Pathom, Thailand |
| 382 | Université de Montpellier | Montpellier, France |
| 384 | Nankai University | Tianjin, China (Mainland) |
| 384 | University of Münster | Munster, Germany |
| 386 | University of Hawaiʻi at Mānoa | Honolulu, United States |
| 387 | National Taiwan University of Science and Technology (Taiwan Tech) | Taipei City, Taiwan |
| 387 | Concordia University | Montreal, Canada |
| 387 | Belarusian State University | Minsk, Belarus |
| 387 | Aix-Marseille University | Marseille, France |
| 387 | Universiti Brunei Darussalam (UBD) | Bandar Seri Begawan, Brunei |
| 392 | Xiamen University | Xiamen, China (Mainland) |
| 392 | Institut National des Sciences Appliquées de Lyon (INSA) | Lyon, France |
| 392 | Technion – Israel Institute of Technology | Haifa, Israel |
| 392 | South China University of Technology | Guangzhou, China (Mainland) |
| 396 | Stony Brook University, State University of New York | Stony Brook, United States |
| 396 | Kazan (Volga region) Federal University | Kazan, Russia |
| 396 | Justus-Liebig-University Giessen | Giessen, Germany |
| 399 | HSE University | Moscow, Russia |
| 400 | Universidade Nova de Lisboa | Lisbon, Portugal |
| 400 | Masaryk University | Brno, Czechia |
| 400 | Iowa State University | Ames, United States |
| 403 | University of Granada | Granada, Spain |
| 404 | University of California, Riverside | Riverside, United States |
| 404 | University of the Philippines | Quezon City, Philippines |
| 404 | Istanbul Technical University | Maslak-Istanbul, Turkey |
| 407 | University of Delhi | New Delhi, India |
| 407 | Auckland University of Technology (AUT) | Auckland, New Zealand |
| 409 | Colorado State University | Fort Collins, United States |
| 410 | University of Southern Queensland | Toowoomba, Australia |
| 410 | Universidad de Santiago de Chile (USACH) | Santiago, Chile |
| 410 | University of Kansas | Lawrence, United States |
| 413 | Oxford Brookes University | Oxford, United Kingdom |
| 413 | Royal Holloway University of London | Egham, United Kingdom |
| 415 | James Cook University | Townsville, Australia |
| 415 | Moscow Institute of Physics and Technology (MIPT / Moscow Phystech) | Dolgoprudny, Russia |
| 415 | The American University in Cairo | Cairo, Egypt |
| 418 | Tomsk State University | Tomsk, Russia |
| 419 | UNESP | Sao Paulo, Brazil |
| 419 | Washington State University | Pullman, United States |
| 421 | Université de Strasbourg | Strasbourg, France |
| 421 | Novosibirsk State University | Novosibirsk , Russia |
| 421 | Université de Liège | Liège, Belgium |
| 421 | Graz University of Technology | Graz, Austria |
| 421 | University of Canberra | Bruce, Australia |
| 426 | University of Limerick | Limerick, Ireland |
| 427 | Anna University | Chennai, India |
| 428 | IE University | Segovia, Spain |
| 429 | University of Trento | Trento, Italy |
| 429 | Singapore University of Technology and Design | Singapore, Singapore |
| 431 | National Taipei University of Technology | Taipei City, Taiwan |
| 431 | National Taiwan Normal University | Taipei City, Taiwan |
| 431 | University of Stirling | Stirling, United Kingdom |
| 431 | Murdoch University | Murdoch, Australia |
| 431 | Koç University | Istanbul, Turkey |
| 436 | Tampere University | Tampere, Finland |
| 436 | University of St.Gallen (HSG) | St. Gallen, Switzerland |
| 436 | Sejong University | Seoul, South Korea |
| 436 | Dublin City University | Dublin, Ireland |
| 436 | University of Science and Technology Beijing | Beijing, China (Mainland) |
| 441 | University of Utah | Salt Lake City, United States |
| 441 | Université Laval | Québec, Canada |
| 441 | University of Dundee | Dundee, United Kingdom |
| 444 | University of Connecticut | Storrs, United States |
| 444 | National and Kapodistrian University of Athens | Athens, Greece |
| 446 | Toyota Technological Institute | Nagoya, Japan |
| 446 | Johannes Kepler University Linz | Linz, Austria |
| 446 | The University of Tennessee, Knoxville | Knoxville, United States |
| 446 | University of Jyväskylä | Jyväskylä, Finland |
| 446 | Aston University | Birmingham, United Kingdom |
| 451 | Iran University of Science and Technology | Tehran, Iran |
| 452 | Université Claude Bernard Lyon 1 | Villeurbanne, France |
| 452 | Central South University | Changsha Shi, China (Mainland) |
| 454 | Czech Technical University in Prague | Prague, Czechia |
| 454 | Southeast University | Nanjing, China (Mainland) |
| 454 | Sultan Qaboos University | Muscat, Oman |
| 454 | Universität Mannheim | Mannheim, Germany |
| 454 | Indian Institute of Technology Indore | Indore, India |
| 459 | Essex, University of | Colchester, United Kingdom |
| 460 | Universität Potsdam | Potsdam, Germany |
| 461 | Florida State University | Tallahassee, United States |
| 461 | National Research Nuclear University MEPhI (Moscow Engineering Physics Institute) | Moscow, Russia |
| 461 | Universität Jena | Jena, Germany |
| 464 | Johannes Gutenberg Universität Mainz | Mainz, Germany |
| 465 | Umea University | Umeå, Sweden |
| 465 | University of Bordeaux | Talence, France |
| 465 | University of Sharjah | Sharjah, United Arab Emirates |
| 465 | Colorado School of Mines | Golden, United States |
| 469 | Università degli Studi di Pavia | Pavia, Italy |
| 469 | Illinois Institute of Technology | Chicago, United States |
| 469 | Ben-Gurion University of The Negev | Be’er Sheva, Israel |
| 472 | Hiroshima University | Higashihiroshima City, Japan |
| 473 | Vilnius University | Vilnius, Lithuania |
| 473 | Ural Federal University – UrFU | Ekaterinburg, Russia |
| 473 | Beihang University (former BUAA) | Beijing, China (Mainland) |
| 476 | Universitat Politecnica de Valencia | València, Spain |
| 476 | Kobe University | Kobe City, Japan |
| 478 | Universität Konstanz | Konstanz, Germany |
| 479 | Universität Leipzig | Leipzig, Germany |
| 480 | Missouri University of Science and Technology | Rolla, United States |
| 481 | Hitotsubashi University | Kunitachi City, Japan |
| 481 | Leibniz University Hannover | Hanover, Germany |
| 481 | Bangor University | Bangor, United Kingdom |
| 481 | Satbayev University | Almaty, Kazakhstan |
| 485 | Universitat de Valencia | València, Spain |
| 486 | University of Guelph | Guelph, Canada |
| 486 | University of Electronic Science and Technology of China | Chengdu, China (Mainland) |
| 489 | University of Rome “Tor Vergata” | Rome, Italy |
| 489 | IPB University (aka Bogor Agricultural University) | Bogor, Indonesia |
| 491 | University of Iowa | Iowa City, United States |
| 491 | Dalian University of Technology | Dalian, China (Mainland) |
| 491 | University at Buffalo SUNY | Buffalo, United States |
| 494 | Rensselaer Polytechnic Institute | Troy, United States |
| 494 | Universidad de Sevilla | Seville, Spain |
| 494 | Chung-Ang University (CAU) | Seoul, South Korea |
| 494 | Hunan University | Changsha, China (Mainland) |
| 498 | Ewha Womans University | Seoul, South Korea |
| 498 | University of Delaware | Newark, United States |
| 498 | Ulster University | Coleraine, United Kingdom |
| 498 | University of Jordan | Amman, Jordan |
| 502 | University of Portsmouth | Portsmouth, United Kingdom |
| 502 | Jilin University | Changchun, China (Mainland) |
| 502 | Bilkent University | Ankara, Turkey |
| 505 | Università Cattolica del Sacro Cuore | Milan, Italy |
| 505 | Macau University of Science and Technology | Macau, Macau SAR |
| 505 | National Sun Yat-sen University | Kaohsiung City, Taiwan |
| 505 | Oregon State University | Corvallis, United States |
| 509 | Sogang University | Seoul, South Korea |
| 509 | University of Bayreuth | Bayreuth, Germany |
| 511 | Université Paul Sabatier Toulouse III | Toulouse, France |
| 511 | East China Normal University | Shanghai, China (Mainland) |
| 511 | SOAS University of London | London, United Kingdom |
| 514 | Shanghai University | Shanghai, China (Mainland) |
| 514 | Bogaziçi Üniversitesi | Istanbul, Turkey |
| 514 | Duy Tan University | Da Nang, Vietnam |
| 514 | Pontificia Universidad Católica Argentina | Buenos Aires, Argentina |
| 514 | Universität Bremen | Bremen, Germany |
| 514 | The University of Georgia | Athens, United States |
| 520 | University of Texas Dallas | Richardson, United States |
| 520 | Universidad Austral | Pilar, Argentina |
| 520 | Kyungpook National University | Daegu, South Korea |
| 523 | Universidad de Zaragoza | Zaragoza, Spain |
| 523 | University of Hull | Hull, United Kingdom |
| 525 | Universiti Teknologi Brunei | Bandar Seri Begawan, Brunei |
| 526 | MGIMO University | Moscow, Russia |
| 526 | Sabanci University | Istanbul, Turkey |
| 526 | University of Madras | Chennai, India |
| 529 | Edith Cowan University | Joondalup, Australia |
| 530 | Aristotle University of Thessaloniki | Thessaloniki, Greece |
| 530 | Christian-Albrechts-University zu Kiel | Kiel, Germany |
| 530 | University of Genoa | Genoa, Italy |
| 530 | Universidad de Palermo (UP) | Buenos Aires, Argentina |
| 534 | Peter the Great St. Petersburg Polytechnic University | St. Petersburg, Russia |
| 534 | University of Salamanca | Salamanca, Spain |
| 534 | University of Crete | Heraklion, Greece |
| 534 | China Agricultural University | Beijing, China (Mainland) |
| 538 | Universiti Utara Malaysia (UUM) | Sintok, Malaysia |
| 538 | Universidad de Alcalá | Alcalá de Henares, Spain |
| 540 | Lahore University of Management Sciences (LUMS) | Lahore, Pakistan |
| 540 | Universidad Nacional de La Plata (UNLP) | La Plata, Argentina |
| 542 | Ulm University | Ulm, Germany |
| 542 | ITMO University | St. Petersburg, Russia |
| 544 | Universidad de Costa Rica | San Jose, Costa Rica |
| 545 | Singapore Management University | Singapore, Singapore |
| 545 | Bar-Ilan University | Ramat Gan, Israel |
| 545 | City University of New York | New York City, United States |
| 548 | Northumbria University at Newcastle | Newcastle upon Tyne, United Kingdom |
| 548 | University of Eastern Finland | Kuopio, Finland |
| 548 | Lehigh University | Bethlehem, United States |
| 551 | University of Nebraska – Lincoln | Lincoln, United States |
| 551 | Canadian University Dubai | Dubai, United Arab Emirates |
| 551 | Hasselt University | Diepenbeek, Belgium |
| 551 | Ajman University | Ajman, United Arab Emirates |
| 555 | Universiti Teknologi MARA – UiTM | Shah Alam, Malaysia |
| 556 | University of Chemistry and Technology, Prague | Prague, Czechia |
| 556 | INTI International University | Nilai, Malaysia |
| 556 | Florida International University | Miami, United States |
| 556 | Renmin (People’s) University of China | Beijing, China (Mainland) |
| 556 | Politecnico di Bari | Bari, Italy |
| 561 | University of Plymouth | Plymouth, United Kingdom |
| 561 | Chongqing University | Chongqing, China (Mainland) |
| 563 | University of South Florida | Tampa, United States |
| 563 | Ateneo de Manila University | Quezon City, Philippines |
| 563 | Université de Fribourg | Fribourg, Switzerland |
| 567 | National Chengchi University | Taipei City, Taiwan |
| 567 | Universidad Adolfo Ibáñez | Santiago, Chile |
| 567 | University of Huddersfield | Huddersfield, United Kingdom |
| 567 | Bond University | Gold Coast, Australia |
| 571 | Warsaw University of Technology | Warsaw, Poland |
| 571 | Indian Institute of Technology BHU Varanasi (IIT BHU Varanasi) | Varanasi, India |
| 571 | Coventry University | Coventry, United Kingdom |
| 571 | Chiang Mai University | Chiang Mai, Thailand |
| 575 | HUFS – Hankuk (Korea) University of Foreign Studies | Seoul, South Korea |
| 575 | University of South Carolina | Columbia, United States |
| 577 | University of Tromsø The Arctic University of Norway | Tromsø, Norway |
| 577 | Taipei Medical University (TMU) | Taipei, Taiwan |
| 577 | Lebanese University | Beirut, Lebanon |
| 580 | University of Klagenfurt | Klagenfurt, Austria |
| 580 | Abu Dhabi University | Abu Dhabi, United Arab Emirates |
| 582 | Comillas Pontifical University | Madrid, Spain |
| 582 | Universidad Católica Andres Bello | Caracas City, Venezuela |
| 582 | Applied Science University – Bahrain | Al-Ekir, Bahrain |
| 586 | National Research Tomsk Polytechnic University | Tomsk, Russia |
| 586 | Sunway University | Petaling Jaya, Malaysia |
| 586 | University of Missouri, Columbia | Columbia, United States |
| 590 | Central Queensland University (CQUniversity Australia) | Norman Gardens, Australia |
| 590 | Manchester Metropolitan University | Manchester , United Kingdom |
| 590 | Prince Mohammad Bin Fahd university | Al Khobar, Saudi Arabia |
| 593 | University of Central Florida | Orlando, United States |
| 593 | Goldsmiths, University of London | London, United Kingdom |
| 595 | Shenzhen University | Shenzhen, China (Mainland) |
| 595 | Pontifícia Universidade Católica do Rio de Janeiro | Rio de Janeiro, Brazil |
| 595 | Nottingham Trent University | Nottingham, United Kingdom |
| 595 | Università Vita-Salute San Raffaele | Milan, Italy |
| 595 | Imam Abdulrahman Bin Faisal University (IAU) | Dammam, Saudi Arabia |
| 600 | Saarland University | Saarbrücken, Germany |
| 600 | Tulane University | New Orleans, United States |
| 600 | Nanjing University of Science and Technology | Nanjing, China (Mainland) |
| 600 | Thammasat University | Bangkok, Thailand |
| 601-610 | Abo Akademi University | Turku, Finland |
| 601-610 | University of Szeged | Szeged, Hungary |
| 601-610 | Drexel University | Philadelphia, United States |
| 601-610 | Jawaharlal Nehru University | New Delhi, India |
| 601-610 | Umm Al-Qura University | Makkah, Saudi Arabia |
| 601-610 | Kingston University, London | Kingston upon Thames, United Kingdom |
| 601-610 | American University in Dubai | Dubai, United Arab Emirates |
| 601-610 | Universidad de Concepción | Concepción, Chile |
| 601-610 | Charles Darwin University | Casuarina, Australia |
| 611-620 | Tokyo Medical and Dental University (TMDU) | Tokyo, Japan |
| 611-620 | National Central University | Taoyuan City, Taiwan |
| 611-620 | Auezov South Kazakhstan University (SKU) | Shymkent, Kazakhstan |
| 611-620 | Martin-Luther-Universität Halle-Wittenberg | Halle, Germany |
| 611-620 | Pusan National University | Busan, South Korea |
| 611-620 | Brno University of Technology | Brno, Czechia |
| 611-620 | University of Minho | Braga, Portugal |
| 611-620 | Al Ain University | Al Ain,, United Arab Emirates |
| 621-630 | Zhengzhou University | Zhengzhou, China (Mainland) |
| 621-630 | Northwestern Polytechnical University | Xi’an, China (Mainland) |
| 621-630 | Chang Gung University | Taoyuan City, Taiwan |
| 621-630 | Institut Teknologi Sepuluh Nopember (ITS Surabaya) | Surabaya, Indonesia |
| 621-630 | Management and Science University | Shah Alam, Malaysia |
| 621-630 | University of Kwazulu-Natal | Pinetown, South Africa |
| 621-630 | University of Ljubljana | Ljubljana, Slovenia |
| 621-630 | University of the Basque Country | Leioa, Spain |
| 621-630 | Asia Pacific University of Technology and Innovation (APU) Malaysia | Kuala Lumpur, Malaysia |
| 621-630 | Stevens Institute of Technology | Hoboken, United States |
| 621-630 | Universitat Ramon Llull | Barcelona, Spain |
| 631-640 | Ajou University | Suwon, South Korea |
| 631-640 | Palacký University Olomouc | Olomouc,, Czechia |
| 631-640 | Université de Lille | Lille, France |
| 631-640 | Ritsumeikan University | Kyoto, Japan |
| 631-640 | Jinan University (China) | Guangzhou, China (Mainland) |
| 631-640 | Boston College | Chestnut Hill, United States |
| 631-640 | Universidad Central de Venezuela | Caracas, Venezuela |
| 631-640 | Saint Joseph University of Beirut (USJ) | Beirut, Lebanon |
| 631-640 | University of New Mexico | Albuquerque, United States |
| 641-650 | University of Windsor | Windsor, Canada |
| 641-650 | Far Eastern Federal University | Vladivostok, Russia |
| 641-650 | Memorial University of Newfoundland | St. John’s, Canada |
| 641-650 | University of Oklahoma | Norman, United States |
| 641-650 | New Jersey Institute of Technology (NJIT) | Newark, United States |
| 641-650 | The New School | New York, United States |
| 641-650 | University of Modena and Reggio Emilia | Modena, Italy |
| 641-650 | Pakistan Institute of Engineering and Applied Sciences (PIEAS) | Islamabad, Pakistan |
| 641-650 | University of Houston | Houston, United States |
| 641-650 | Lingnan University, Hong Kong | Hong Kong, Hong Kong SAR |
| 641-650 | Universidad de La Habana | Havana, Cuba |
| 641-650 | University of Bradford | Bradford, United Kingdom |
| 641-650 | Free University of Bozen-Bolzano | Bolzano, Italy |
| 641-650 | Kazakh National Agrarian Research University KazNARU | Almaty, Kazakhstan |
| 651-660 | Tallinn University of Technology (TalTech) | Tallinn, Estonia |
| 651-660 | University of Hohenheim | Stuttgart, Germany |
| 651-660 | Universidad de Montevideo (UM) | Montevideo, Uruguay |
| 651-660 | Instituto Tecnológico Autónomo de México (ITAM) | Mexico City, Mexico |
| 651-660 | Southern Cross University | Lismore, Australia |
| 651-660 | COMSATS University Islamabad | Islamabad, Pakistan |
| 651-660 | University of Haifa | Haifa, Israel |
| 661-670 | Brandeis University | Waltham, United States |
| 661-670 | Ca’ Foscari University of Venice | Venice, Italy |
| 661-670 | Universitat Rovira i Virgili | Tarragona, Spain |
| 661-670 | National Chung Hsing University | Taichung City, Taiwan |
| 661-670 | Princess Nourah bint Abdulrahman University | Riyadh, Saudi Arabia |
| 661-670 | Università degli Studi di Perugia | Perugia, Italy |
| 661-670 | Universidad Panamericana (UP) | Mexico City, Mexico |
| 661-670 | Middlesex University | London, United Kingdom |
| 661-670 | Tokyo University of Science | Kagurazaka, Japan |
| 661-670 | Holy Spirit University of Kaslik | Jounieh, Lebanon |
| 661-670 | Karl-Franzens-Universitaet Graz | Graz, Austria |
| 661-670 | Lebanese American University | Byblos, Lebanon |
| 661-670 | Universitas Padjadjaran (UNPAD) | Bandung, Indonesia |
| 661-670 | Aberystwyth University | Aberystwyth, United Kingdom |
| 671-680 | University of Manitoba | Winnipeg, Canada |
| 671-680 | Dongguk University | Seoul, South Korea |
| 671-680 | Carleton University | Ottawa, Canada |
| 671-680 | University of Greenwich | Greenwich, United Kingdom |
| 671-680 | American University of the Middle East | Egaila, Kuwait |
| 671-680 | University of Debrecen | Debrecen, Hungary |
| 681-690 | Pontificia Universidad Católica de Valparaíso | Valparaíso, Chile |
| 681-690 | Soochow University | Suzhou, China (Mainland) |
| 681-690 | Shiraz University | Shiraz, Iran |
| 681-690 | East China University of Science and Technology | Shanghai, China (Mainland) |
| 681-690 | Paris Lodron University of Salzburg | Salzburg , Austria |
| 681-690 | The National University of Science and Technology MISIS | Moscow, Russia |
| 681-690 | El Colegio de México, A.C. | Mexico City, Mexico |
| 681-690 | De La Salle University | Manila, Philippines |
| 681-690 | University of Kentucky | Lexington, United States |
| 681-690 | Taras Shevchenko National University of Kyiv | Kyiv, Ukraine |
| 681-690 | Abai Kazakh National Pedagogical University | Almaty, Kazakhstan |
| 691-700 | University of Trieste | Trieste, Italy |
| 691-700 | Indian Institute of Technology Hyderabad (IITH) | Sangareddy, India |
| 691-700 | Universidade Federal do Rio Grande Do Sul | Porto Alegre, Brazil |
| 691-700 | University of Mons | Mons, Belgium |
| 691-700 | Universidad Iberoamericana IBERO | Mexico City, Mexico |
| 691-700 | V. N. Karazin Kharkiv National University | Kharkiv, Ukraine |
| 691-700 | Inha University | Incheon, South Korea |
| 691-700 | University of Dhaka | Dhaka, Bangladesh |
| 691-700 | University of Cincinnati | Cincinnati, United States |
| 691-700 | Universidade Federal de Minas Gerais | Belo Horizonte, Brazil |
| 701-710 | Wake Forest University | Winston-Salem, United States |
| 701-710 | Universidade de Santiago de Compostela | Santiago de Compostela, Spain |
| 701-710 | Czech University of Life Sciences in Prague | Prague, Czechia |
| 701-710 | Universidad de Antioquia | Medellin, Colombia |
| 701-710 | Chiba University | Chiba City, Japan |
| 701-710 | Eötvös Loránd University | Budapest, Hungary |
| 701-710 | Altai State University | Barnaul, Russia |
| 701-710 | Zayed University | Abu Dhabi,, United Arab Emirates |
| 711-720 | Université de Rennes 1 | Rennes, France |
| 711-720 | Savitribai Phule Pune University | Pune, India |
| 711-720 | Victoria University | Melbourne, Australia |
| 711-720 | University of Westminster | London, United Kingdom |
| 711-720 | International Islamic University Malaysia (IIUM) | Kuala Lumpur, Malaysia |
| 711-720 | Istanbul University | Istanbul, Turkey |
| 711-720 | University of New Brunswick | Fredericton, Canada |
| 711-720 | Universidad del Rosario | Bogotá, Colombia |
| 711-720 | Beirut Arab University | Beirut, Lebanon |
| 711-720 | China University of Petroleum, Beijing | Beijing, China (Mainland) |
| 711-720 | University of Maryland, Baltimore County | Baltimore, United States |
| 721-730 | Temple University | Philadelphia, United States |
| 721-730 | Université Côte d’Azur | Nice, France |
| 721-730 | Université de Lorraine | Nancy, France |
| 721-730 | Jeonbuk National University | Jeonju, South Korea |
| 721-730 | Ton Duc Thang University | Ho Chi Minh City, Vietnam |
| 721-730 | University of Oregon | Eugene, United States |
| 721-730 | University of Colorado, Denver | Denver, United States |
| 721-730 | Ain Shams University in Cairo (ASU, Cairo) | Cairo, Egypt |
| 721-730 | University of Belgrade | Belgrade, Serbia |
| 721-730 | Beijing University of Chemical Technology | Beijing, China (Mainland) |
| 721-730 | Universita’ Politecnica delle Marche | Ancona, Italy |
| 731-740 | University of Siena | Siena, Italy |
| 731-740 | Universidade Federal de São Paulo | São Paulo, Brazil |
| 731-740 | Alfaisal University | Riyadh, Saudi Arabia |
| 731-740 | Adam Mickiewicz University, Poznań | Poznań, Poland |
| 731-740 | Bournemouth University | Poole, United Kingdom |
| 731-740 | Universidad EAFIT | Medellin, Colombia |
| 731-740 | National Technical University of Ukraine “Igor Sikorsky Kyiv Polytechnic Institute” | Kyiv, Ukraine |
| 731-740 | Jordan University of Science & Technology | Irbid, Jordan |
| 731-740 | Indian Institute of Technology Bhubaneswar | Bhubaneswar, India |
| 741-750 | Sofia University “St. Kliment Ohridski” | Sofia, Bulgaria |
| 741-750 | Universität Regensburg | Regensburg, Germany |
| 741-750 | Swarthmore College | Philadelphia, United States |
| 741-750 | University of the Punjab | Lahore, Pakistan |
| 741-750 | Jadavpur University | Kolkata, India |
| 741-750 | University of Agriculture, Faisalabad | Faisalabad, Pakistan |
| 741-750 | Instituto Politécnico Nacional (IPN) | Ciudad de México, Mexico |
| 741-750 | Budapest University of Technology and Economics | Budapest, Hungary |
| 741-750 | University of the West of England | Bristol, United Kingdom |
| 741-750 | University of Bari | Bari, Italy |
| 751-760 | University of Zagreb | Zagreb, Croatia |
| 751-760 | University of Ulsan | Ulsan, South Korea |
| 751-760 | Riga Technical University | Riga, Latvia |
| 751-760 | Université du Québec | Québec, Canada |
| 751-760 | University of Mumbai | Mumbai, India |
| 751-760 | Ahlia University | Manama, Bahrain |
| 751-760 | Liverpool John Moores University | Liverpool , United Kingdom |
| 751-760 | ISCTE-IUL | Lisbon, Portugal |
| 751-760 | Wayne State University | Detroit, United States |
| 751-760 | Technische Universität Braunschweig | Braunschweig, Germany |
| 751-760 | Universidad Externado de Colombia | Bogotá, Colombia |
| 751-760 | Kasetsart University | Bangkok, Thailand |
| 761-770 | Universität Rostock | Rostock, Germany |
| 761-770 | Virginia Commonwealth University | Richmond, United States |
| 761-770 | Philipps-Universität Marburg | Marburg, Germany |
| 761-770 | Universiti Tenaga Nasional (UNITEN) | Kajang, Malaysia |
| 761-770 | Universidad de Belgrano | Buenos Aires, Argentina |
| 761-770 | Hacettepe University | Ankara, Turkey |
| 761-770 | King Khalid University | Abha, Saudi Arabia |
| 771-780 | Shoolini University of Biotechnology and Management Sciences | Solan, India |
| 771-780 | Rutgers University–Newark | Newark, United States |
| 771-780 | Nantes Université | Nantes, France |
| 771-780 | Sechenov University | Moscow, Russia |
| 771-780 | Universidad ORT Uruguay | Montevideo, Uruguay |
| 771-780 | Chandigarh University | Mohali, India |
| 771-780 | Universidad Anáhuac México | Huixquilucan, Mexico |
| 771-780 | Universität Duisburg-Essen | Duisburg, Germany |
| 771-780 | University of Brighton | Brighton, United Kingdom |
| 771-780 | Comenius University Bratislava | Bratislava, Slovakia |
| 771-780 | University at Albany SUNY | Albany, United States |
| 781-790 | China University of Mining and Technology | Xuzhou, China (Mainland) |
| 781-790 | Khoja Akhmet Yassawi International Kazakh-Turkish University | Turkestan, Kazakhstan |
| 781-790 | National Institute of Technology, Tiruchirappalli | Tiruchirappalli, India |
| 781-790 | Syracuse University | Syracuse, United States |
| 781-790 | University of Northern British Columbia | Prince George, Canada |
| 781-790 | Nanjing Agricultural University | Nanjing, China (Mainland) |
| 781-790 | Universiti Malaysia Pahang | Kuantan, Malaysia |
| 781-790 | Keele University | Keele, United Kingdom |
| 781-790 | The Catholic University of Korea | Gyeonggi, South Korea |
| 781-790 | University of Alaska Fairbanks | Fairbanks, United States |
| 791-800 | American University | Washington D.C., United States |
| 791-800 | Diponegoro University | Semarang, Indonesia |
| 791-800 | Clarkson University | Potsdam, United States |
| 791-800 | University of Patras | Patras, Greece |
| 791-800 | Plekhanov Russian University of Economics | Moscow, Russia |
| 791-800 | Lanzhou University | Lanzhou, China (Mainland) |
| 791-800 | University of Engineering & Technology (UET) Lahore | Lahore, Pakistan |
| 791-800 | Instituto Tecnológico de Buenos Aires (ITBA) | Buenos Aires, Argentina |
| 791-800 | University of Brescia | Brescia, Italy |
| 791-800 | Universidad de La Sabana | Bogotá, Colombia |
| 801-850 | Yokohama City University | Yokohama City, Japan |
| 801-850 | China University of Geosciences | Wuhan, China (Mainland) |
| 801-850 | Clark University | Worcester, United States |
| 801-850 | Vilnius Gediminas Technical University (VILNIUS TECH) | Vilnius, Lithuania |
| 801-850 | Verona University | Verona, Italy |
| 801-850 | Universidad Técnica Federico Santa María (USM) | Valparaíso, Chile |
| 801-850 | Tokyo University of Agriculture and Technology | Tokyo, Japan |
| 801-850 | Ivane Javakhishvili Tbilisi State University | Tbilisi, Georgia |
| 801-850 | Université de Sherbrooke | Sherbrooke, Canada |
| 801-850 | Konkuk University | Seoul, South Korea |
| 801-850 | Jouf University | Sakaka, Saudi Arabia |
| 801-850 | University of Latvia | Riga, Latvia |
| 801-850 | Universidad San Francisco de Quito (USFQ) | Quito, Ecuador |
| 801-850 | Almaty Technological University | Provo, Kazakhstan |
| 801-850 | Poznan University of Life Sciences | Poznań, Poland |
| 801-850 | North-West University | Potchefstroom, South Africa |
| 801-850 | University of Pecs | Pécs, Hungary |
| 801-850 | Nanjing University of Aeronautics and Astronautics | Nanjing, China (Mainland) |
| 801-850 | Nagasaki University | Nagasaki City, Japan |
| 801-850 | Universidad de la República (Udelar) | Montevideo, Uruguay |
| 801-850 | Belarusian National Technical University (BNTU) | Minsk, Belarus |
| 801-850 | Australian Catholic University | Melbourne, Australia |
| 801-850 | Universidad Pontificia Bolivariana | Medellín, Colombia |
| 801-850 | Maynooth University | Maynooth, Ireland |
| 801-850 | University of Santo Tomas | Manila, Philippines |
| 801-850 | Universitas Brawijaya | Malang , Indonesia |
| 801-850 | Texas Tech University | Lubbock, United States |
| 801-850 | De Montfort University | Leicester, United Kingdom |
| 801-850 | University of Calcutta | Kolkata, India |
| 801-850 | Kaunas University of Technology | Kaunas, Lithuania |
| 801-850 | Vytautas Magnus University | Kaunas, Lithuania |
| 801-850 | Karaganda State Technical University | Karaganda, Kazakhstan |
| 801-850 | Universiti Tunku Abdul Rahman (UTAR) | Kampar, Malaysia |
| 801-850 | Immanuel Kant Baltic Federal University | Kaliningrad, Russia |
| 801-850 | University of Hyderabad | Hyderabad, India |
| 801-850 | Universidade Federal de Santa Catarina | Florianópolis, Brazil |
| 801-850 | University of Salerno | Fisciano, Italy |
| 801-850 | Edinburgh Napier University | Edinburgh, United Kingdom |
| 801-850 | University Duesseldorf | Düsseldorf, Germany |
| 801-850 | University of Dubai | Dubai, United Arab Emirates |
| 801-850 | Bangladesh University of Engineering and Technology | Dhaka, Bangladesh |
| 801-850 | Babes-Bolyai University | Cluj-Napoca, Romania |
| 801-850 | Universidad de San Andrés – UdeSA | Buenos Aires, Argentina |
| 801-850 | Universidade de Brasília | Brasília, Brazil |
| 801-850 | University of Massachusetts Boston | Boston, United States |
| 801-850 | Ritsumeikan Asia Pacific University | Beppu City, Japan |
| 801-850 | University of Balamand | Beirut, Lebanon |
| 801-850 | Beijing University of Technology | Beijing, China (Mainland) |
| 801-850 | Louisiana State University | Baton Rouge, United States |
| 801-850 | Charles Sturt University | Bathurst, Australia |
| 801-850 | Auburn University | Auburn, United States |
| 801-850 | Al-Ahliyya Amman University | Amman, Jordan |
| 801-850 | University of Alicante | Alicante, Spain |
| 851-900 | Huazhong Agricultural University | Wuhan, China (Mainland) |
| 851-900 | Wuhan University of Technology | Wuhan, China (Mainland) |
| 851-900 | Worcester Polytechnic Institute | Worcester, United States |
| 851-900 | Vellore Institute of Technology (VIT), Vellore, India | Vellore, India |
| 851-900 | Toronto Metropolitan University | Toronto, Canada |
| 851-900 | Oklahoma State University | Stillwater, United States |
| 851-900 | National Research Saratov State University | Saratov, Russia |
| 851-900 | Universidad Central “Marta Abreu” de Las Villas | Santa Clara, Cuba |
| 851-900 | University of Salford | Salford, United Kingdom |
| 851-900 | Southern Federal University | Rostov-on-Don, Russia |
| 851-900 | University of South Africa | Pretoria, South Africa |
| 851-900 | University of Parma | Parma, Italy |
| 851-900 | CY Cergy Paris University | Paris, France |
| 851-900 | Universite Paris-Pantheon-Assas | Paris, France |
| 851-900 | University of Palermo | Palermo, Italy |
| 851-900 | Niigata University | Niigata City, Japan |
| 851-900 | Queen Margaret University , Edinburgh | Musselburgh, United Kingdom |
| 851-900 | University of Malta | Msida, Malta |
| 851-900 | Universidad Católica del Uruguay (UCU) | Montevideo, Uruguay |
| 851-900 | Wesleyan University | Middletown, United States |
| 851-900 | University of Messina (UniME) | Messina, Italy |
| 851-900 | University of Maribor | Maribor, Slovenia |
| 851-900 | Kansas State University | Manhattan, United States |
| 851-900 | London South Bank University | London, United Kingdom |
| 851-900 | University of East London | London, United Kingdom |
| 851-900 | University of Lincoln | Lincoln, United Kingdom |
| 851-900 | Gulf University for Science and Technology | Kuwait City, Kuwait |
| 851-900 | Kuwait University | Kuwait City, Kuwait |
| 851-900 | Pavol Jozef Šafárik University in Košice | Košice, Slovakia |
| 851-900 | Karaganda Buketov University | Karaganda, Kazakhstan |
| 851-900 | Kanazawa University | Kanazawa, Japan |
| 851-900 | Michigan Technological University | Houghton, United States |
| 851-900 | King Faisal University | Hofuf, Saudi Arabia |
| 851-900 | University of Hertfordshire | Hatfield, United Kingdom |
| 851-900 | Chonnam National University | Gwangju, South Korea |
| 851-900 | Universidad de Guadalajara (UDG) | Guadalajara, Mexico |
| 851-900 | Gdańsk University of Technology | Gdańsk, Poland |
| 851-900 | Universita’ degli Studi di Ferrara | Ferrara, Italy |
| 851-900 | Technological University Dublin | Dublin, Ireland |
| 851-900 | TU Dortmund University | Dortmund, Germany |
| 851-900 | North South University | Dhaka, Bangladesh |
| 851-900 | Chungnam National University | Daejeon, South Korea |
| 851-900 | Clemson University | Clemson, United States |
| 851-900 | Catania University | Catania, Italy |
| 851-900 | Universidad Torcuato Di Tella | Buenos Aires, Argentina |
| 851-900 | University of Bucharest | Bucharest, Romania |
| 851-900 | Kyrgyz-Turkish Manas University | Bishkek, Kyrgyzstan |
| 851-900 | Beijing University of Posts and Telecommunications | Beijing, China (Mainland) |
| 851-900 | Georgia State University | Atlanta, United States |
| 851-900 | Addis Ababa University | Addis Ababa, Ethiopia |
| 901-950 | University of Wroclaw | Wroclaw, Poland |
| 901-950 | Wroclaw University of Science and Technology (WRUST) | Wroclaw , Poland |
| 901-950 | College of William and Mary | Williamsburg, United States |
| 901-950 | Universidade de Vigo | Vigo, Spain |
| 901-950 | D. Serikbayev East Kazakhstan Technical University | Ust-Kamenogorsk, Kazakhstan |
| 901-950 | Nicolaus Copernicus University | Toruń, Poland |
| 901-950 | Sophia University | Tokyo, Japan |
| 901-950 | Asia University Taiwan | Taichung City, Taiwan |
| 901-950 | Saint Louis University | St. Louis, United States |
| 901-950 | Donghua University | Shanghai, China (Mainland) |
| 901-950 | Sungshin Women’s University | Seoul, South Korea |
| 901-950 | Samara National Research University (Samara University) | Samara, Russia |
| 901-950 | Università degli studi Roma Tre | Rome, Italy |
| 901-950 | Riga Stradins University | Riga, Latvia |
| 901-950 | Pontificia Universidad Católica del Ecuador (PUCE) | Quito, Ecuador |
| 901-950 | Ocean University of China | Qingdao, China (Mainland) |
| 901-950 | University of Central Lancashire | Preston, United Kingdom |
| 901-950 | Okayama University | Okayama City, Japan |
| 901-950 | University of Murcia | Murcia, Spain |
| 901-950 | West Virginia University | Morgantown, United States |
| 901-950 | National Chung Cheng University | Minxiong Township, Taiwan |
| 901-950 | Universidad Autónoma Metropolitana (UAM) | Mexico City, Mexico |
| 901-950 | London Metropolitan University | London, United Kingdom |
| 901-950 | Universidade Católica Portuguesa – UCP | Lisbon, Portugal |
| 901-950 | Universidad Nacional Mayor de San Marcos | Lima, Peru |
| 901-950 | Kumamoto University | Kumamoto City, Japan |
| 901-950 | AGH University of Krakow | Krakow, Poland |
| 901-950 | Notre Dame University-Louaize NDU | Koura, Lebanon |
| 901-950 | National Technical University “Kharkiv Polytechnic Institute” | Kharkiv, Ukraine |
| 901-950 | Prince of Songkla University | Hat Yai, Thailand |
| 901-950 | Rhodes University | Grahamstown, South Africa |
| 901-950 | University of Denver | Denver, United States |
| 901-950 | UPES | Dehradun, India |
| 901-950 | Hallym University | Chuncheon, South Korea |
| 901-950 | Loyola University Chicago | Chicago, United States |
| 901-950 | Universidad ICESI | Cali, Colombia |
| 901-950 | University of Vermont | Burlington, United States |
| 901-950 | Qassim University | Buraydah, Saudi Arabia |
| 901-950 | Mendel University in Brno | Brno, Czechia |
| 901-950 | University of Alabama at Birmingham | Birmingham, United States |
| 901-950 | Beijing Jiaotong University | Beijing, China (Mainland) |
| 901-950 | Athens University of Economics and Business | Athens, Greece |
| 901-950 | Northern Borders University | Arar, Saudi Arabia |
| 901-950 | Ankara Üniversitesi | Ankara, Turkey |
| 901-950 | Princess Sumaya University for Technology | Amman, Jordan |
| 901-950 | Asfendiyarov Kazakh National Medical University | Almaty, Kazakhstan |
| 901-950 | Alexandria University | Alexandria, Egypt |
| 901-950 | Robert Gordon University | Aberdeen, United Kingdom |
| 951-1000 | University of Bahrain | Zallaq, Bahrain |
| 951-1000 | Yokohama National University | Yokohama City, Japan |
| 951-1000 | Northwest Agriculture and Forestry University | Yangling, China (Mainland) |
| 951-1000 | Universidad de Valladolid | Valladolid, Spain |
| 951-1000 | The University of Alabama | Tuscaloosa, United States |
| 951-1000 | Université de Tunis El Manar | Tunis, Tunisia |
| 951-1000 | Université Toulouse 1 Capitole | Toulouse, France |
| 951-1000 | Tokyo Metropolitan University | Tokyo, Japan |
| 951-1000 | Shahid Beheshti University (SBU) | Tehran, Iran |
| 951-1000 | Universiti Pendidikan Sultan Idris (UPSI) | Tanjong Malim, Malaysia |
| 951-1000 | Sumy State University | Sumy, Ukraine |
| 951-1000 | Saint Petersburg Electrotechnical University ETU-LETI | St. Petersburg, Russia |
| 951-1000 | O.P. Jindal Global University | Sonepat, India |
| 951-1000 | University of Seoul | Seoul, South Korea |
| 951-1000 | Universidad de los Andes – Chile | Santiago, Chile |
| 951-1000 | Universidad Diego Portales (UDP) | Santiago, Chile |
| 951-1000 | Universidad Peruana Cayetano Heredia (UPCH) | San Martin, Peru |
| 951-1000 | Universidad Nacional de Rosario (UNR) | Rosario, Argentina |
| 951-1000 | University of Calabria | Rende, Italy |
| 951-1000 | Birla Institute of Technology and Science, Pilani | Pilani, India |
| 951-1000 | University of Peshawar | Peshawar, Pakistan |
| 951-1000 | Thapar Institute of Engineering & Technology | Patiala, India |
| 951-1000 | Universidad Tecnológica de Panamá (UTP) | Panama City, Panama |
| 951-1000 | Jamia Millia Islamia | New Delhi, India |
| 951-1000 | Universidad Rey Juan Carlos | Móstoles, Spain |
| 951-1000 | Manipal Academy of Higher Education, Manipal, Karnataka, India | Manipal, India |
| 951-1000 | Gunma University | Maebashi, Japan |
| 951-1000 | Islamic University of Madinah | Madinah, Saudi Arabia |
| 951-1000 | Lviv Polytechnic National University | Lviv, Ukraine |
| 951-1000 | University of Lodz | Lodz, Poland |
| 951-1000 | Universidad Nacional de Ingeniería | Lima, Peru |
| 951-1000 | University of Ghana | Legon, Ghana |
| 951-1000 | Khon Kaen University | Khon Kaen, Thailand |
| 951-1000 | Makerere University | Kampala, Uganda |
| 951-1000 | Yildiz Technical University | Istanbul, Turkey |
| 951-1000 | Indiana University–Purdue University Indianapolis | Indianapolis, United States |
| 951-1000 | Viet Nam National University Ho Chi Minh City (VNU-HCM) | Ho Chi Minh City, Vietnam |
| 951-1000 | Vietnam National University, Hanoi | Hanoi, Vietnam |
| 951-1000 | Yeungnam University | Gyeongsan, South Korea |
| 951-1000 | Gifu University | Gifu City, Japan |
| 951-1000 | UNIVERSITY OF GDANSK | Gdańsk, Poland |
| 951-1000 | George Mason University | Fairfax, United States |
| 951-1000 | Universidad Nacional de Córdoba – UNC | Córdoba, Argentina |
| 951-1000 | Universidad de Castilla-La Mancha | Ciudad Real, Spain |
| 951-1000 | Universidad de las Américas Puebla (UDLAP) | Cholula, Mexico |
| 951-1000 | South Ural State University (National Research University) | Chelyabinsk, Russia |
| 951-1000 | Tecnológico de Costa Rica -TEC | Cartago, Costa Rica |
| 951-1000 | Universidad Simón Bolívar (USB) | Caracas, Venezuela |
| 951-1000 | University of the Western Cape | Cape Town, South Africa |
| 951-1000 | Bielefeld University | Bielefeld, Germany |
| 951-1000 | King Mongkut’s University of Technology Thonburi | Bangkok, Thailand |
| 951-1000 | University of Baghdad | Baghdad, Iraq |
| 951-1000 | University of New England Australia | Armidale, Australia |
| 951-1000 | NJSC KIMEP University | Almaty, Kazakhstan |
| 1001-1200 | Tomas Bata University in Zlin | Zlin, Czechia |
| 1001-1200 | University of Zilina | Zilina, Slovakia |
| 1001-1200 | Northwest University (China) | Xi’an, China (Mainland) |
| 1001-1200 | Jiangnan University | Wuxi, China (Mainland) |
| 1001-1200 | Howard University | Washington D.C., United States |
| 1001-1200 | Baylor University | Waco, United States |
| 1001-1200 | Università degli Studi della Tuscia (University of Tuscia) | Viterbo, Italy |
| 1001-1200 | Mykolas Romeris University | Vilnius, Lithuania |
| 1001-1200 | Banaras Hindu University | Varanasi, India |
| 1001-1200 | Universidad Austral de Chile | Valdivia, Chile |
| 1001-1200 | Ufa State Aviation Technical University (USATU) | Ufa, Russia |
| 1001-1200 | Università degli Studi di Udine | Udine, Italy |
| 1001-1200 | University of Tyumen | Tyumen, Russia |
| 1001-1200 | University of Tulsa | Tulsa, United States |
| 1001-1200 | Université Toulouse – Jean Jaurès | Toulouse, France |
| 1001-1200 | Universidad Autónoma del Estado de México (UAEMex) | Toluca de Lerdo, Mexico |
| 1001-1200 | University of Toledo | Toledo, United States |
| 1001-1200 | International Christian University | Tokyo, Japan |
| 1001-1200 | Meiji University | Tokyo, Japan |
| 1001-1200 | Tokushima University | Tokushima City, Japan |
| 1001-1200 | ITESO, Universidad Jesuita de Guadalajara | Tlaquepaque, Mexico |
| 1001-1200 | Universidad Autonoma Chapingo | Texcoco, Mexico |
| 1001-1200 | University of Wolverhampton | Telford, United Kingdom |
| 1001-1200 | Chung Yuan Christian University | Taoyuan City, Taiwan |
| 1001-1200 | Universidad Nacional del Centro de la Provincia de Buenos Aires (UNICEN) | Tandil, Argentina |
| 1001-1200 | Tallinn University | Tallinn, Estonia |
| 1001-1200 | Universidad de Talca | Talca, Chile |
| 1001-1200 | Chang Jung Christian University | Tainan City, Taiwan |
| 1001-1200 | Universitas Sebelas Maret | Surakarta, Indonesia |
| 1001-1200 | University of the Sunshine Coast | Sunshine Coast, Australia |
| 1001-1200 | Mississippi State University | Starkville, United States |
| 1001-1200 | Saint-Petersburg Mining University | St. Petersburg, Russia |
| 1001-1200 | Université de Sousse | Sousse, Tunisia |
| 1001-1200 | Universität Siegen | Siegen, Germany |
| 1001-1200 | Shanghai International Studies University | Shanghai, China (Mainland) |
| 1001-1200 | University of Sfax | Sfax, Tunisia |
| 1001-1200 | Dankook University | Seoul, South Korea |
| 1001-1200 | Kookmin University | Seoul, South Korea |
| 1001-1200 | Seoul National University of Science and Technology | Seoul, South Korea |
| 1001-1200 | Pontifícia Universidade Católica de São Paulo | São Paulo, Brazil |
| 1001-1200 | Universidade Federal de São Carlos (UFSCar) | São Paulo, Brazil |
| 1001-1200 | Instituto Tecnológico de Santo Domingo (INTEC) | Santo Domingo, Dominican Republic |
| 1001-1200 | Universidad Andrés Bello | Santiago, Chile |
| 1001-1200 | Universidad de Oriente, Santiago de Cuba | Santiago de Cuba, Cuba |
| 1001-1200 | Universidad de Monterrey (UDEM) | San Pedro Garza García, Mexico |
| 1001-1200 | Universidad Autónoma de Nuevo León | San Nicolás de los Garza, Mexico |
| 1001-1200 | Universidad Nacional de San Luis | San Luis , Argentina |
| 1001-1200 | Universidad Nacional de la Asunción | San Lorenzo, Paraguay |
| 1001-1200 | Universidad de Puerto Rico | San Juan, Puerto Rico |
| 1001-1200 | University of San Francisco | San Francisco, United States |
| 1001-1200 | San Diego State University | San Diego , United States |
| 1001-1200 | University of Texas at San Antonio | San Antonio, United States |
| 1001-1200 | Rochester Institute of Technology (RIT) | Rochester, United States |
| 1001-1200 | Imam Mohammad Ibn Saud Islamic University – IMSIU | Riyadh, Saudi Arabia |
| 1001-1200 | University of Regina | Regina, Canada |
| 1001-1200 | Universidade Federal de Pernambuco (UFPE) | Recife, Brazil |
| 1001-1200 | Escuela Politécnica Nacional | Quito, Ecuador |
| 1001-1200 | Brigham Young University | Provo, United States |
| 1001-1200 | Poznan University of Technology | Poznan, Poland |
| 1001-1200 | Université de Poitiers | Poitiers, France |
| 1001-1200 | University of Pardubice | Pardubice, Czechia |
| 1001-1200 | Universidad Autónoma del Estado de Hidalgo (UAEH) | Pachuca, Mexico |
| 1001-1200 | University of Mississippi | Oxford, United States |
| 1001-1200 | Universidad de Oviedo | Oviedo, Spain |
| 1001-1200 | VSB – Technical University of Ostrava | Ostrava, Czechia |
| 1001-1200 | Odessa I.I.Mechnikov National University | Odessa, Ukraine |
| 1001-1200 | Novosibirsk State Technical University | Novosibirsk, Russia |
| 1001-1200 | University of Novi Sad | Novi Sad, Serbia |
| 1001-1200 | The University of Northampton | Northampton, United Kingdom |
| 1001-1200 | Amity University | Noida, India |
| 1001-1200 | Lobachevsky University | Nizhny Novgorod, Russia |
| 1001-1200 | Harper Adams University | Newport, United Kingdom |
| 1001-1200 | Fordham University | New York City, United States |
| 1001-1200 | Future University in Egypt | New Cairo, Egypt |
| 1001-1200 | University of Naples Parthenope | Naples, Italy |
| 1001-1200 | Nanjing Normal University | Nanjing, China (Mainland) |
| 1001-1200 | Vancouver Island University | Nanaimo, Canada |
| 1001-1200 | University of Nairobi | Nairobi, Kenya |
| 1001-1200 | An-Najah National University | Nablus, Palestinian Territories |
| 1001-1200 | Mutah University | Mu’tah, Jordan |
| 1001-1200 | University of Idaho | Moscow, United States |
| 1001-1200 | Financial University under the Government of the Russian Federation | Moscow, Russia |
| 1001-1200 | Russian Presidential Academy of National Economy and Public Administration | Moscow, Russia |
| 1001-1200 | Paul Valéry University Montpellier | Montpellier, France |
| 1001-1200 | Universidad Peruana de Ciencias Aplicadas | Monterrico, Peru |
| 1001-1200 | University of Wisconsin Milwaukee | Milwaukee, United States |
| 1001-1200 | Universidad La Salle, México | Mexico City, Mexico |
| 1001-1200 | Universidad de Los Andes – (ULA) Mérida | Merida, Venezuela |
| 1001-1200 | Universidad Nacional de Cuyo | Mendoza, Argentina |
| 1001-1200 | Taibah University | Medina, Saudi Arabia |
| 1001-1200 | Shinshu University | Matsumoto City, Japan |
| 1001-1200 | Ferdowsi University of Mashhad | Mashhad, Iran |
| 1001-1200 | Mansoura University | Mansoura , Egypt |
| 1001-1200 | Universitas Hasanuddin | Makassar, Indonesia |
| 1001-1200 | CEU Universities | Madrid, Spain |
| 1001-1200 | Université Lumière Lyon 2 | Lyon, France |
| 1001-1200 | University of Louisville College of Business | Louisville, United States |
| 1001-1200 | Utah State University | Logan, United States |
| 1001-1200 | Lodz University of Technology | Lodz, Poland |
| 1001-1200 | Universitat de Lleida (University of Lleida) | Lleida, Spain |
| 1001-1200 | Universidad de Lima | Lima, Peru |
| 1001-1200 | Technical University of Liberec | Liberec, Czechia |
| 1001-1200 | Universidad de León | León, Spain |
| 1001-1200 | Leeds Beckett University | Leeds, United Kingdom |
| 1001-1200 | University of Salento | Lecce (LE), Italy |
| 1001-1200 | University of Wyoming | Laramie, United States |
| 1001-1200 | The University of Lahore | Lahore, Pakistan |
| 1001-1200 | Doshisha University | Kyoto, Japan |
| 1001-1200 | Kyoto Institute of Technology | Kyoto, Japan |
| 1001-1200 | National University of Kyiv-Mohyla Academy (NaUKMA) | Kyiv, Ukraine |
| 1001-1200 | Universiti Malaysia Sarawak (UNIMAS) | Kuching, Malaysia |
| 1001-1200 | Universiti Malaysia Terengganu (UMT) | Kuala Terengganu, Malaysia |
| 1001-1200 | Universiti Kuala Lumpur (UniKL) | Kuala Lumpur , Malaysia |
| 1001-1200 | Siberian Federal University, SibFU | Krasnoyarsk, Russia |
| 1001-1200 | Cracow University of Technology (Politechnika Krakowska) | Krakow, Poland |
| 1001-1200 | Universiti Malaysia Sabah (UMS) | Kota Kinabalu, Malaysia |
| 1001-1200 | Technical University of Kosice | Košice, Slovakia |
| 1001-1200 | University of Primorska | Koper, Slovenia |
| 1001-1200 | Kyushu Institute of Technology | Kitakyushu, Japan |
| 1001-1200 | University of Rhode Island | Kingston, United States |
| 1001-1200 | Kent State University | Kent, United States |
| 1001-1200 | Kazan National Research Technological University | Kazan, Russia |
| 1001-1200 | University of Karachi | Karachi, Pakistan |
| 1001-1200 | University of Missouri, Kansas City | Kansas City, United States |
| 1001-1200 | Universiti Malaysia Perlis | Kangar, Malaysia |
| 1001-1200 | Kagoshima University | Kagoshima City, Japan |
| 1001-1200 | Universidad del Pacífico | Jesús María, Peru |
| 1001-1200 | Bina Nusantara University (BINUS) | Jakarta, Indonesia |
| 1001-1200 | EGE UNIVERSITY | İzmir, Turkey |
| 1001-1200 | University of Ioannina | Ioannina, Greece |
| 1001-1200 | University of Hradec Kralove | Hradec Králové, Czechia |
| 1001-1200 | Tokai University | Hiratsuka City, Japan |
| 1001-1200 | Universidad Nacional Costa Rica | Heredia, Costa Rica |
| 1001-1200 | Harbin Engineering University | Harbin, China (Mainland) |
| 1001-1200 | Szechenyi Istvan University (University of Gyor) | Győr, Hungary |
| 1001-1200 | Escuela Superior Politécnica del Litoral (ESPOL) | Guayaquil, Ecuador |
| 1001-1200 | Universidad Autónoma de Guadalajara (UAG) | Guadalajara, Mexico |
| 1001-1200 | Silesian University of Technology | Gliwice, Poland |
| 1001-1200 | Glasgow Caledonian University | Glasgow, United Kingdom |
| 1001-1200 | Northern Arizona University | Flagstaff, United States |
| 1001-1200 | University of Arkansas Fayetteville | Fayetteville, United States |
| 1001-1200 | Sheffield Hallam University | false false |
| 1001-1200 | University of Texas El Paso | El Paso, United States |
| 1001-1200 | Al-Quds University | East Jerusalem, Palestinian Territories |
| 1001-1200 | University of New Hampshire | Durham, United States |
| 1001-1200 | BRAC University | Dhaka, Bangladesh |
| 1001-1200 | University of Derby | Derby, United Kingdom |
| 1001-1200 | University of North Texas | Denton, United States |
| 1001-1200 | Southern Methodist University | Dallas, United States |
| 1001-1200 | Multimedia University (MMU) | Cyberjaya, Malaysia |
| 1001-1200 | Universidade Federal do Paraná – UFPR | Curitiba, Brazil |
| 1001-1200 | Universidad de Córdoba | Córdoba, Spain |
| 1001-1200 | University of Colombo | Colombo,, Sri Lanka |
| 1001-1200 | Kangwon National University | Chuncheon, South Korea |
| 1001-1200 | Southwest University | Chongqing, China (Mainland) |
| 1001-1200 | Universita’ degli Studi “G. d’Annunzio” Chieti Pescara | Chieti, Italy |
| 1001-1200 | Chungbuk National University | Cheongju, South Korea |
| 1001-1200 | Sathyabama Institute of Science and Technology (Deemed to be University) | Chennai, India |
| 1001-1200 | University of North Carolina at Charlotte | Charlotte, United States |
| 1001-1200 | Panjab University | Chandigarh, India |
| 1001-1200 | University of South Bohemia in České Budějovice | České Budějovice, Czechia |
| 1001-1200 | Universidad Metropolitana | Caracas, Venezuela |
| 1001-1200 | Universidad del Valle | Cali, Colombia |
| 1001-1200 | Université de Caen Normandie | Caen, France |
| 1001-1200 | Universidad Tecnológica Nacional (UTN) | Buenos Aires, Argentina |
| 1001-1200 | Corvinus University of Budapest | Budapest, Hungary |
| 1001-1200 | MATE Hungarian University of Agriculture and Life Sciences | Budapest, Hungary |
| 1001-1200 | Universidad Industrial de Santander – UIS | Bucaramanga, Colombia |
| 1001-1200 | Slovak University of Technology in Bratislava | Bratislava, Slovakia |
| 1001-1200 | University of the Free State | Bloemfontein, South Africa |
| 1001-1200 | Birmingham City University | Birmingham, United Kingdom |
| 1001-1200 | Binghamton University SUNY | Binghamton, United States |
| 1001-1200 | University of Deusto | Bilbao, Spain |
| 1001-1200 | Canterbury Christ Church University | Bexleyheath, United Kingdom |
| 1001-1200 | Beijing Foreign Studies University | Beijing, China (Mainland) |
| 1001-1200 | Beijing University of Chinese Medicine | Beijing, China (Mainland) |
| 1001-1200 | Universiti Tun Hussein Onn Malaysia (UTHM) | Batu Pahat, Malaysia |
| 1001-1200 | Universidad del Norte | Barranquilla, Colombia |
| 1001-1200 | Telkom University | Bandung, Indonesia |
| 1001-1200 | Azerbaijan State University of Economics | Baku, Azerbaijan |
| 1001-1200 | Baku State University | Baku, Azerbaijan |
| 1001-1200 | Mustansiriyah University | Baghdad, Iraq |
| 1001-1200 | Ohio University | Athens, United States |
| 1001-1200 | Assiut University | Asyut, Egypt |
| 1001-1200 | Soonchunhyang University | Asan, South Korea |
| 1001-1200 | The University of Texas at Arlington | Arlington, United States |
| 1001-1200 | Gazi Üniversitesi | Ankara, Turkey |
| 1001-1200 | Amrita Vishwa Vidyapeetham | Amritapuri, India |
| 1001-1200 | German Jordanian University | Amman, Jordan |
| 1001-1200 | Kazakh Ablai Khan University of International Relations and World Languages | Almaty, Kazakhstan |
| 1001-1200 | Kazakh-British Technical University | Almaty, Kazakhstan |
| 1001-1200 | Aligarh Muslim University | Aligarh, India |
| 1001-1200 | Arab Academy for Science, Technology and Maritime Transport (AASTMT) | Alexandria, Egypt |
| 1001-1200 | Universidade da Coruña | A Coruña, Spain |